Start 2026 with a plan your team can rally around.
Planning for 2026 doesn’t have to be complicated. This guide walks you through how to prep for a productive planning process, set clear priorities, and communicate, measure, and manage your strategic plan so it actually works.
Build focus, alignment, and momentum to start the year strong — and stay that way.
To have an effective capacity planning approach, you need a system that allows you to make strategic, confident, and future-forward decisions. That being said, finding the right solution can feel daunting—so stick around! We outline key factors to consider when assessing capacity planning software below.
Understanding Capacity Planning for Digital Agencies
When we talk about “capacity planning”, we know this could have a number of different meanings and associations. So, let’s first align on what capacity planning really is and why it matters.
Capacity planning helps agencies understand what kind of services and products their customers and prospects want now. It helps predict future needs so agency leaders can plan and invest in the right resources with confidence. In it’s simplest form, capacity planning is about knowing supply and demand, both now and in the future.
Gaining a clear picture of supply and demand comes with phenomenal perks that both leaders and their teams benefit from.
What are the Benefits of Capacity Planning?
Improved Resource Management: Resource management focuses on assigning the right talent to keep projects moving forward, and capacity planning focuses on forecasting future needs—but these two practices should lean on each other. When you hit your stride with capacity planning, for example, you’ll be able to better, more effectively manage resources for current projects AND avoid overcommitting to future projects if the right resources aren’t available.
“What If?” Planning: Capacity planning provides the ability to create what-if scenarios to help leaders truly think through and plan for everything so no one is caught off guard. It’s “if this, then that”-type of planning that helps avoid last-minute scrambles and ease the rollercoaster of too much work/not enough people (or vice versa).
Proactive Decision-making: Capacity planning helps leaders identify potential resource constraints early on in the project lifecycle so they can take steps to address them before they become a bigger problem. This can help businesses avoid delays and ensure the successful delivery of projects.
The services industry will constantly be evolving, and there will always be economically challenging times that leaders will have to navigate. Given that capacity planning helps organizations navigate with more confidence and greater ease, you need to ensure your approach to capacity planning is effective and scalable.
Factors to Consider When Choosing Capacity Planning Software
How should you go about choosing the right system? We know there’s a lot of noise in the market, and navigating all the different options can be overwhelming. So, let’s break it down…
Consider discussing the following capabilities and characteristics with the solution partners you connect with:
Ease of Use: How easy is it to use?
It’s a simple question, but you’d be surprised how many systems aren’t easy to use today. Your software should be easy to use once onboarded onto the platform. If it needs training during the product implementation process, be sure to keep an eye out for unexpected fees. This is especially important for digital agencies that may have multiple team members and various roles using the software. The software should include easy-to-follow instructions, tutorials, and customer support to assist users in using it.
Integration with Existing Tools:Does it integrate with other tools?
Another crucial factor to consider when choosing capacity planning software is its compatibility with other tools. The software should work well with tools you already use, like your CRM and project management tools. This helps provide you and your teams with a central, cohesive home-base for everything.
Scalability:Can it scale?
Your capacity planning software should be scalable and able to handle a growing number of projects, users, and resources. As your business grows, it’s essential to have a software solution that can handle current needs and keep up with the increasing and evolving demands.
Reporting and Analytics: What reporting and analytics features does it offer?
The solution you use should provide detailed reporting and analytics, helping you and your team make informed, strategic decisions about your capacity and resources now and for future. It also should offer real-time visibility into the resources being utilized so you can easily identify trends, patterns, and areas for improvement, which can help build confidence, enable strategic forecasting, and drive profitability.
Budget and Pricing: How much does it cost?
Of course, you need to consider the budget and pricing of capacity planning solutions. Ideally, the software should drive both immediate and long-lasting value, so it’s important to consider not only the upfront costs of the software but also any ongoing maintenance or support and training fees (don’t forget to inquire about add-on fees!). Make sure to also consider any potential cost savings or efficiencies that the software may provide in the long run.
How to Start Capacity Planning
At Parallax, we work with companies spanning every stage of the operational maturity curve to drive the behaviors that will lead to strategic forecasting and capacity planning. Unlike legacy PSA solutions, which take between 12-18 months to roll out and adopt, Parallax has you up and running in 90 days with minimal disruption to your broader team.
We also understand the importance of maintaining business continuity, which is why our software is designed to integrate seamlessly with your existing toolset, ensuring a smooth transition and minimizing the learning curve for your team. By leveraging the tools you already know and love, Parallax can help you streamline your capacity planning processes, optimize your resources, and achieve greater efficiency and profitability without causing any major disruptions to your existing workflows.
Ultimately, we’re here to help you sustain your business, grow your business AND keep your talent happy and fulfilled. All it takes is implementing capacity planning best practices and unlocking true, strategic forecasting—and that’s exactly what we do.
Resource management is like a well-choreographed dance for digital services shops and agencies. It’s the weekly hustle where leaders juggle and allocate people’s time to projects—and yes, we know it can feel like a tactical headache, but it’s incredibly important to get right (or close to right!).
Resource management and resource planning for professional services businesses don’t need to be stressful. With a fresh perspective and a different approach, it can be a fun, strategic process that can help take your business to the next level. Yup, we said fun.
No more guessing games or last-minute scrambles. With our tips below, you’ll gain control over resource management and resource planning and be better equipped to lead your team with finesse and confidence.
Picture this: a surprise spike in demand hits you out of nowhere. Maybe it’s an urgent request from an existing client or a new client in crisis mode needing your help. It could even be a last-minute new business pitch that one of your key team members is pulled in on.
These unexpected spikes in demand can catch teams off guard, and they can definitely mess with resourcing plans, often leaving leaders to navigate what feels like an always-on scramble. In other words, being in a constant reactive state with resource management can be a real game-changer—and not in a good way.
If you’re constantly making decisions on the fly and relying on the same go-to people to handle new work, it can quickly spiral into a resourcing nightmare. Teams are always playing catch-up, leaders are putting out fires, and everyone is struggling to keep up with the ever-changing demands. It can lead to overburdened team members, missed deadlines, and even burnout.
Operating in a reactive state also prevents leaders from having a clear strategic vision when it comes to capacity planning and resource allocation. It hampers the ability to plan ahead, anticipate potential challenges, and make informed decisions based on data and insights.
How can you avoid this? First, know that trying to cram all resourcing decisions into just one or two weeks is too short-sighted. It’s a “robbing Peter to pay Paul” situation just to survive the week. This type of approach will most certainly erode confidence in the organization’s future. There’s a better way to tackle resource management. It requires taking a strategic, long-term approach, looking beyond the week at hand, and planning for the future. This is how you can break free from the vicious resourcing cycle and start to build confidence in your organization.
The Solution Starts with Services Resource Planning
It only takes a small shift in your approach to resource management – leveling it up to services resource planning – to gain more confidence, better forecasting, and improved performance.
To ensure we’re on the same page, here’s what we mean when we talk about resource planning vs. resource management – and how both are slightly different from resource forecasting:
Resource forecasting (also called capacity planning) involves leaders predicting where they should invest in resources to meet changing needs and future goals (i.e., new services, market expansion, company growth), using current workloads and sales pipeline data to inform their predictions.
Resource planning involves leveraging the forecast to develop an actionable plan, assigning specific people and resources to specific projects.
Resource management is the process of monitoring the progress of projects against resources, ensuring everything is on time and on budget + making real-time adjustments as needed.
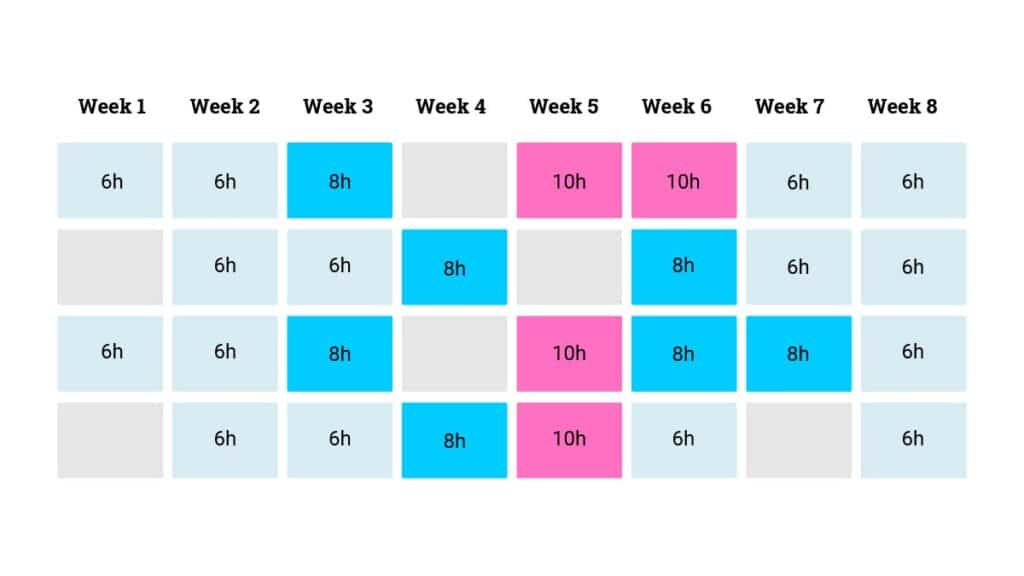
Now, here’s how we recommend evolving your resourcing strategy: keep your weekly resource management meetings, but instead of only planning 1-2 weeks ahead, try allocating hours 6-8 weeks out based on the information you have on hand (the forecasted data won’t be all-encompassing, but it’s a great starting point).
We know planning 6-8 weeks out might feel intimidating, but it doesn’t require a big lift to start experiencing the benefits—and the business outcomes will be notable. Again, these elongated plans do not need to be super precise. They need to be directionally correct using larger increments for allocation (i.e., 25% of a role). You’ll then refine and add more precision to the resource plans closer to each week. These directionally-correct plans will give you a CONSISTENT sense of what’s to come, which is likely more than you have today. And of course, over time, your ability to improve precision further out will get better and easier.
Still unsure about what it takes to improve your resource planning approach? Not sure you have the right tools to make it happen?
We’re here to make your life easier. The Parallax platform is a powerful force multiplier for the valuable tools you already use, allowing you to say goodbye to clunky, homegrown spreadsheets that just patch the gaps between different functions in your services business.
With Parallax, services companies get reliable data and actionable insights all in one place. Our resourcing and planning engine curates critical resourcing and forecasting data, providing you with a shared source of truth on how your business is performing. This means leaders can make smart, data-driven resourcing decisions that are future-forward and based on data rather than gut instinct.
No more guesswork. No more spreadsheets. No more outdated information.
Parallax empowers services companies to elevate their resource and capacity planning game and unlock the full potential of their data for better business performance. ✨When you’re ready to shift your perspective on resourcing being a complicated puzzle to a well-thought-out strategy that sets you up for sustainable success, let’s connect.
Parallax, a leading provider of predictive forecasting and capacity planning software, announced today the successful completion of its Series B funding round. The funding round was led by Baird Capital, a global private equity and venture capital firm specializing in technology innovation. Parallax plans to utilize the new capital to further accelerate product development, expand its market presence, and strengthen its position as a pioneer in the digital services space.
The Series B funding round generated a total investment of $12M from a combination of existing and new investors, demonstrating a strong vote of confidence in Parallax’s growth potential. In addition to Baird Capital, other notable participants include Rally Ventures and Grotech . The successful completion of this round brings Parallax’s total funding to date to $24.5M, positioning the company for an exciting future.
“We’re excited to partner with Baird Capital, to accelerate our vision to revolutionize resource planning and forecasting in the professional services industry with our predictive analytics platform. This investment will further refine our user-centered product and fast track the expansion of AI and prescriptive analytics built into our platform. As we chart our course for the next three years, we’re more committed than ever to our mission: transforming businesses by unlocking the potential of people. We are grateful for Baird Capital’s confidence in our vision,” said Tom O’Neill, CEO and co-founder of Parallax.
“Through our own investments in professional services businesses across the Baird Capital portfolio, we’ve witnessed firsthand the importance of effective resource management and its impact on workforce utilization and profitability,” said Jim Pavlik, Partner with Baird Capital’s Venture team and newly appointed Board member at Parallax. “We’ve been extremely impressed with Parallax’s cloud-based platform and its ability to optimize resource planning and forecasting for its clients and are very excited to partner with the Parallax team and support their continued investments in growing the business.”
The Series B funding will primarily be utilized to fuel Parallax’s product innovation initiatives, expand its teams, and further scale its operations to meet the growing demand for its solutions. In addition, the company plans to invest in sales and marketing efforts to broaden its market reach and strengthen customer relationships.
About Parallax
Parallax is a strategic, predictive capacity and resource planning solution built for digital service organizations. Centered around the most critical agency operational pillars – capacity planning, resource management, project financials, and operations intelligence – Parallax helps maximize efficiency of resources, ensure utilization goals are met, and track and improve project margin.
About Baird Capital
Baird Capital manages two investment platforms: Global Private Equity and U.S. Venture Capital and makes investments in B2B technology & services-focused companies around the world. Having invested in 339 companies over its history, Baird Capital provides operational support to its portfolio companies through teams on the ground in the United States, Europe and Asia. Baird Capital is the direct private investment arm of Robert W. Baird & Co.
Financial reporting is everyone’s favorite topic, right? ….right?
Financial reporting can feel overwhelming for some agency leaders and team members, so we’re here to help. We break down why financial reporting tools are important and how they’re used. There’s also a list of financial reporting software tools to consider for your agency below. Don’t worry: we detail how the Parallax platform fits into the financial reporting equation, too. Let’s dive in!
In the simplest terms, financial reporting software is a tool that enables digital agency leaders to track, manage, and analyze their financial data. It’s meant to help agencies monitor their financial health and performance, make informed business decisions, and plan for the future.
It’s typically used by agency owners, finance teams, and other key decision-makers to gain insights into their financial data and make strategic decisions. When implemented and leveraged properly, financial reporting software helps to streamline financial processes, reduce errors, and gain deeper insights into financial performance, enabling leaders to make better business decisions.
Financial Reporting Software Use Cases
There are a variety of different use cases for financial reporting software for digital agencies, including analyzing profitability by client or project, tracking employee productivity, forecasting cash flow, and generating financial statements and reports for stakeholders.
Here’s what we usually see these solutions leveraged for:
Budgeting and Forecasting: Financial reporting software can help digital agencies create budgets and financial forecasts. This can be done by analyzing historical data and predicting future trends, which can help leaders plan their resources and investments. It can also help identify potential cash flow problems before they occur, allowing leaders to take proactive measures to address them.
Client Billing and Invoicing: Digital agencies often work with multiple clients, and financial reporting software can streamline the billing and invoicing process. This includes generating invoices based on agreed-upon billing rates, tracking time and expenses against projects, and reconciling payments received against outstanding invoices.
Performance Tracking and Reporting: Leaders need to track various performance metrics to understand the effectiveness of their marketing campaigns and to optimize strategies as needed. Financial reporting software can be used to measure key performance indicators (KPIs) such as revenue, profit margins, client acquisition costs, and project profitability. This information can then be used to make informed decisions about resource allocation, client acquisition, and marketing strategies.
Why Digital Agencies Need Financial Reporting Tools
Financial reporting tools help digital agencies improve financial control, make better business decisions, and stay compliant with regulatory requirements. Here’s how:
Financial Control: Financial reporting software helps digital shops and agencies maintain better control over their financial data, track expenses, and monitor revenue. These tools can provide insights into the profitability of individual projects, identify cost savings opportunities, and improve cash flow management.
Business Decision-Making: Financial reporting tools provide leaders with the data they need to make informed business decisions. By tracking KPIs such as revenue growth, profit margins, and customer acquisition costs, leaders can make more strategic decisions around staffing, pricing, and resource allocation.
Compliance: Agencies need to comply with various regulatory and tax requirements, and financial reporting tools can help automate many of these processes. By streamlining compliance tasks such as tax reporting, invoicing, and payroll, agencies can save time and reduce the risk of errors.
How Parallax Fits Into the Financial Reporting Equation
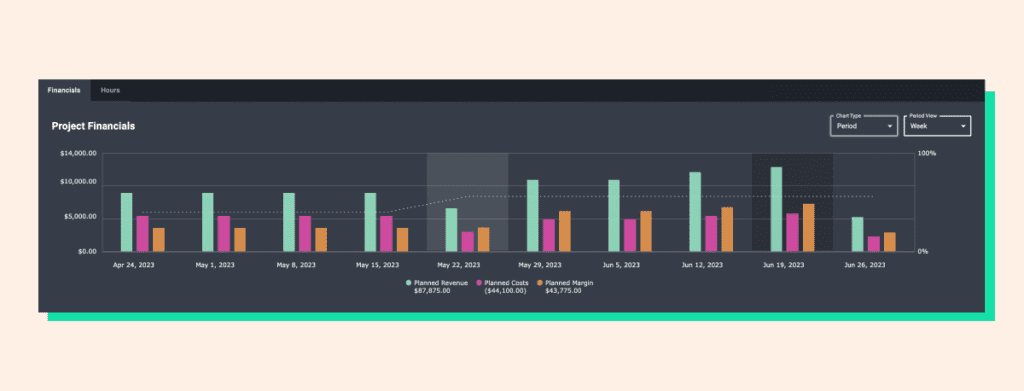
Is Parallax a financial reporting software solution? Nope! It’s an integrated resource planning, capacity planning, and active forecasting tool that gives project managers and leadership a real-time view into project financial performance and projections (think: sold vs. actuals and project margin). Parallax integrates with other valuable tools like CRMs and project management and time-tracking solutions, allowing performance and forecasting data to be exported and used alongside financial reporting systems to help provide strategic insights for optimizing performance today and planning for tomorrow.
Drilling down to the project level, Parallax monitors revenue and margin against set plans and provides real-time insights to help teams understand performance in real-time. It also supports multiple billing models (i.e., time and materials, fixed fee, or retainer) and tracks team performance and costs throughout a project to reduce surprises and overages.
On the resourcing and capacity planning front, Parallax makes managing a team across several different projects easier by tracking hours and costs with consistency. In addition, it connects data between sales and resource teams to help sales attach directionally accurate resource plans to deals as early as possible to avoid any resourcing (or financial!) hiccups.
Ultimately, by making real-time performance and forecasting data available alongside financial reporting software insights, the Parallax platform arms digital agency leaders with the information they need to make smart decisions and to keep their people focused on doing their best work.
5 Key Features of Financial Reporting Software
#1. Real-Time Data Insights
Digital agency leaders need financial insights (income and expense tracking, invoice and payment tracking, tax reporting, etc.) from their financial reporting software to make informed business decisions promptly. These insights give them a clear understanding of their company’s financial performance at any given time and help them identify potential issues before they become significant problems.
#2. Forecasting
Without financial forecasting capabilities, leaders would have a limited understanding of their business’s future financial performances. With forecasting capabilities, they’re able to see beyond the current financial period and plan for long-term success. Look for financial reporting software that helps to identify potential opportunities and risks that may affect the business and shows where and how leaders could make adjustments to their operations based on the forecasted financial outcomes.
#3. Integrations
When financial reporting software integrates with other important solutions and tools, agencies experience streamlined operations and greater efficiencies across the business. Take integrations with project management (PM) tools, for example: when financial reporting software connects with PM tools, team leaders and project managers can more easily track project expenses, manage budgets, and track the profitability of each project. There’s also key benefits of integrating financial reporting software with payment processing solutions, CRM systems, payroll systems, inventory management tools, and more.
#4. Best for Larger Corporations
For larger corporations, financial reporting software solutions typically offer more advanced features such as multi-entity management, multi-currency support, and more in-depth reporting capabilities. These organizations often have more complex financial needs and require software that can handle the volume of data and transactions they generate. They also typically have larger budgets to invest in more expensive software solutions.
#5. Best for Small-to-midsize Businesses
Small-to-midsize businesses may not require the same level of complexity and features as larger corporations. They usually have simpler financial reporting needs and tend to require more affordable software solutions. They also may not have the same resources and technical expertise to manage more complex software solutions, so the team may benefit from software solutions that offer more user-friendly interfaces and ease of use.
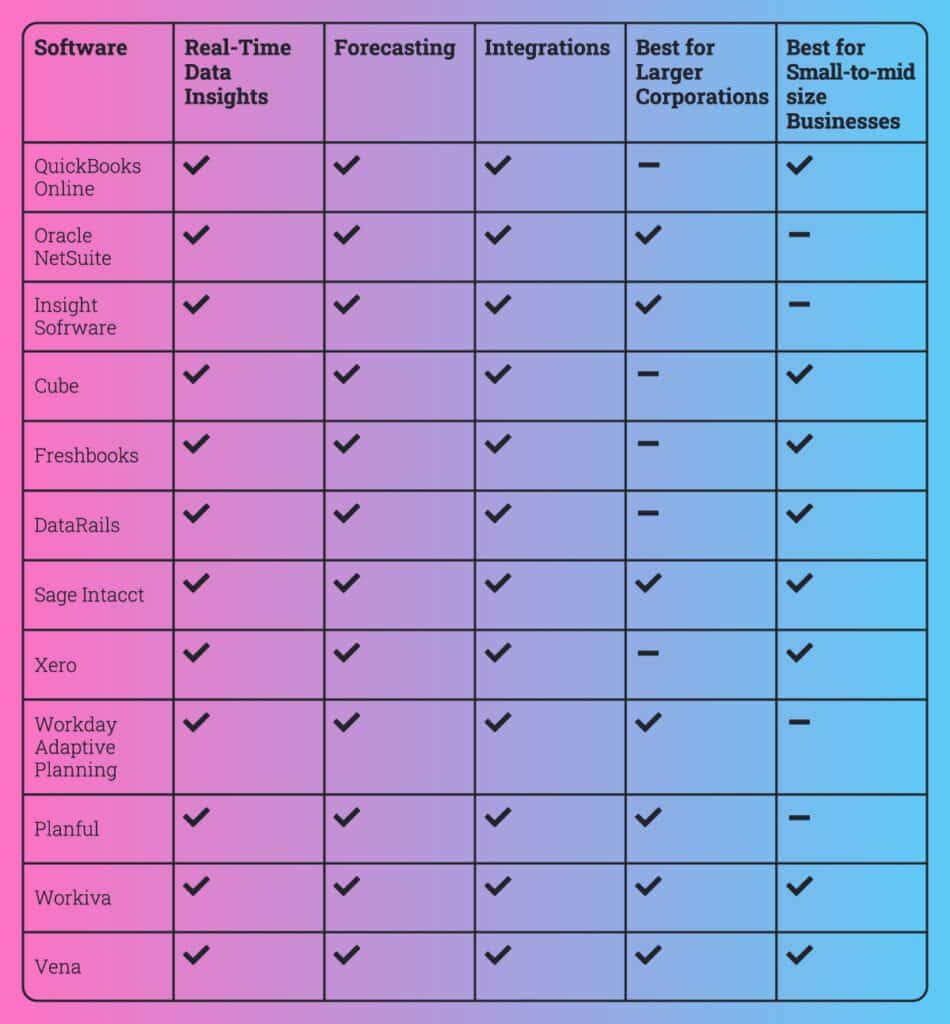
Best Financial Reporting Software for Digital Agencies
There are a lot of tools on the market to consider and demo to understand which solution may work best for your unique needs. Here’s a starter list to consider:
#1. QuickBooks Online
QuickBooks Online is a robust financial reporting and accounting software solution that offers automation, customization, and integrations that can help digital agency leaders manage their finances more effectively. One standout feature of QuickBooks Online is its ability to automate many financial tasks, such as invoicing, payment processing, and expense tracking. Another unique feature is its customizable reporting capabilities. Users can create custom reports that provide insights into key financial metrics, such as revenue, profit, and cash flow.
#2. Oracle NetSuite
Oracle NetSuite is a cloud-based financial management system that provides end-to-end accounting and financial management capabilities. It offers features such as real-time financial reporting, order and billing management, revenue recognition, and inventory management as well as customizable dashboards and reporting tools. Its multi-currency and multi-language capabilities make it ideal for global operations. Additionally, NetSuite offers robust integration capabilities, allowing for seamless integration with third-party applications and systems.
#3. Insight Software
Insight Software is a financial reporting and business intelligence solution designed for midsize to large businesses that need robust financial reporting and analysis capabilities. It offers features such as real-time data integration from multiple sources, customized dashboards, and ad-hoc reporting capabilities, and it provides financial consolidation, budgeting, forecasting, and planning tools to help businesses make informed financial decisions. It offers a user-friendly interface and intuitive reporting tools to help users quickly analyze and visualize their data.
#4. Cube
Cube offers features such as customizable dashboards, ad-hoc reporting, and drill-down capabilities to help users quickly analyze their data. Cube provides forecasting and budgeting tools to help businesses make informed financial decisions, and it integrates with other financial and accounting software, such as QuickBooks, Sage, and Xero, to consolidate financial data and streamline reporting processes. It’s designed for small to medium-sized businesses that need real-time financial insights to make data-driven decisions.
#5. Freshbooks
Freshbooks is a cloud-based accounting and invoicing software designed for small businesses and freelancers. It offers a user-friendly interface and easy-to-use features such as time tracking, project management, and automatic billing. One of its unique features is the ability to accept online payments directly from invoices. Freshbooks also offers a variety of customizable templates for invoices, estimates, and proposals. Its mobile app allows users to track expenses and manage invoices on-the-go. Additionally, Freshbooks integrates with a variety of third-party apps such as PayPal, Stripe, and G Suite to streamline business processes.
#6. DataRails
DataRails is a financial reporting solution that is designed to automate spreadsheet management and enhance data accuracy. Its unique feature is the ability to provide a unified view of financial data from multiple sources, including ERP systems, CRMs, and other financial applications. The software also uses machine learning to identify patterns and errors in financial data, improving the accuracy of financial reporting. With DataRails, users can easily collaborate on spreadsheets in real-time, track changes, and manage access permissions. The solution provides users with a dashboard that displays key metrics and KPIs, and allows users to drill down into financial data to gain insights.
#7. Sage Intacct
Sage Intacct is designed to streamline accounting processes and enable businesses to make better financial decisions. Its unique features include advanced automation, multi-entity consolidation, real-time dashboards, and built-in compliance tools. It offers comprehensive financial management tools such as accounts payable and receivable, general ledger, and cash management. Sage Intacct integrates with other business systems to provide a complete financial management solution, and its flexible platform can scale to meet the needs of growing businesses, making it a popular choice for mid-sized companies.
#8. Xero
Xero helps small-to-medium-sized businesses manage their finances with ease. Its unique features include automatic bank feeds, easy invoicing and payment processing, expense tracking, and financial reporting. Xero allows users to create custom reports and dashboards, and offers an ecosystem of third-party apps and integrations for added functionality. Its mobile app provides real-time access to financial data, and its multi-currency support makes it ideal for businesses operating internationally.
#9. Workday Adaptive Planning
Workday Adaptive Planning enables businesses to create financial forecasts and models. With its intuitive interface and flexible modeling capabilities, it allows users to build custom models, set financial goals and budgets, and track progress against those goals. It also offers advanced analytics and scenario planning tools that allow businesses to anticipate changes in the market and plan accordingly. Additionally, the software integrates with a wide range of ERP systems and other applications, making it easy to share data and streamline workflows.
#10. Planful
Planful is a cloud-based financial planning and analysis (FP&A) platform that provides various features such as budgeting, forecasting, reporting, consolidations, and analytics. With Planful, companies can create and manage complex financial models, visualize their data, and generate insightful reports. Its automation capabilities can help reduce the manual workload and increase accuracy in financial planning and analysis. Planful’s open API allows integration with various systems, including ERPs, CRMs, and HR systems, to provide a complete view of the organization’s performance.
#11. Workiva
Workiva provides a single platform to manage and automate reporting processes. It enables users to seamlessly collaborate on reports with colleagues, reviewers, and auditors in real-time, and its real-time data monitoring capabilities allow users to track changes, flag issues, and drill down into details, providing a comprehensive view of financial performance. Users can also integrate with external data sources, such as ERP systems and other financial applications, to automate data input and streamline reporting processes. Additionally, Workiva provides various compliance and regulatory features that ensure data accuracy, consistency, and completeness, making it an ideal solution for companies of all sizes, particularly those with complex financial reporting needs.
#12. Vena
Vena is designed to help businesses automate budgeting, planning, and forecasting processes. Its unique features include the ability to automate complex financial processes such as consolidation, data validation, and currency translation. It also offers a centralized data repository that allows users to easily manage and access financial data from multiple sources. Overall, Vena is an ideal solution for businesses looking to streamline their financial processes, improve their forecasting accuracy, and gain valuable insights into their financial performance.
Connect with Parallax
Interested in learning how Parallax works alongside financial reporting solutions? We’re more than happy to talk through any questions you have. So, when you’re ready to chat, we’re ready to chat.
As digital services continue to evolve, digital agencies face increasing pressure to deliver high-quality work while meeting tight deadlines and maintaining profitability. Resource management and capacity planning are crucial aspects of achieving these goals, and they play a significant role in determining the success or failure of digital agencies.
Resource management involves managing people, equipment, and other resources to achieve specific goals, whereas capacity planning is the process of estimating the resources needed to meet future demand. We dive in deeper on these critical best practices, along with the tools needed to help streamline everything. Just keep scrolling.
In digital services, capacity planning is crucial to ensure that companies have enough resources to handle future projects and avoid overloading their employees, equipment, and systems. It also helps to inform what and who the agency should invest in. Think of it as supply and demand.
Capacity planning software helps with this process. It’s an essential digital tool that allows digital agencies to forecast their resource requirements and optimize their resource allocation. This type of software provides insights into future resource needs and helps to allocate resources to the most critical projects. It can also help to identify potential capacity bottlenecks and reallocate resources to resolve them.
Keep in mind, if you’re attempting to forecast where your business is heading (and which resources you’ll need to support it) by using homegrown or legacy technology, you’ll inevitably run into issues. These solutions are slow moving and often don’t provide the integrated, forward-looking view needed to strategically plan for what’s to come. There are other solutions today designed to enable future-looking forecasting and proactive resource and capacity planning. These solutions – like the Parallax platform – provide a clearer picture of the here and now to help efficiently allocate resources AND serve up insights about what lies ahead so you can plan accordingly.
3 Reasons Why Capacity Planning Tools Are Important for Digital Agencies
Capacity planning tools are essential for digital agencies for several reasons. With the right tool in your toolbox, you’ll be able to:
Improve Resource Allocation
Capacity planning tools enable digital agencies to allocate resources effectively and efficiently, ensuring that each resource is assigned to the most critical projects. This way, resources are not wasted, and projects are completed on time.
Increase Efficiency
With capacity planning software, digital agencies can optimize their resource utilization, ensuring that each resource is utilized to its fullest potential. This leads to increased efficiency, reduced downtime, and increased profitability.
Better Manage Projects
Capacity planning software helps digital agencies manage their projects better by providing insights into future resource needs. This way, they can plan and execute projects more effectively, resulting in better project outcomes and higher client satisfaction.
3 Features to Look for in Capacity Planning Software
When selecting capacity planning software, digital agencies should look for the following features:
Real-time Data Visualization
Capacity planning software should provide real-time data visualization to enable digital agencies to make data-driven decisions quickly.
Automatic Resource Allocation
Capacity planning software should have automatic resource allocation features to ensure that resources are allocated optimally and efficiently.
“What-if” Scenario Planning
Capacity planning software should provide the ability to create “what-if” scenarios to enable digital agencies to simulate different scenarios and make informed decisions based on the results.
8 Best Capacity Planning Tools for Digital Agencies
Finding the capacity planning software that’s best for your business is ultimately up to you—but if we can make your search any easier, we’re happy to help. Here’s a list of powerful tools that support smoother, streamlined capacity planning:
Parallax
Parallax is a strategic resourcing planning and forecasting solution that works with best-in-class tools to serve up an accurate view into operational health. It provides predictive and proactive tools that enable strategic, forward-looking decision-making, allowing leaders to focus on the growth, health, and happiness of the business and its people. Rather than your sales pipeline data being locked in the CRM, Parallax makes it easy to share key data points across Sales, Operations, and Delivery teams so that everyone has the necessary context for effective resource management and capacity planning.
ClickUp
ClickUp is a project management tool that offers robust capacity planning and resource utilization capabilities. It helps answer various questions around your capacity management process, helping to determine available capacity with its Workload View feature that helps you plan and visualize your team’s capacity by tracking metrics such as hours, tasks, and points.
Kantata
Formerly Mavenlink and Kimble, Kantata centralizes operations and tools into one core solution to help services organizations optimize their resource planning and decision making.
Runn
Runn software has a variety of tools that allow you to manage resources efficiently, including its resource utilization report that shows which resources are in demand as well as its people planner that tracks resource allocations, including vacation time, in a calendar view. Runn also offers a capacity planning dashboard that shows the capacity of the entire organization against current workloads to help with real-time understanding and future planning.
Saviom
Saviom is a capacity planning solution that has a suite of applications, including project portfolio management, workforce planning software, and professional service automation. It helps solve complexities around capacity planning by making it easier to forecast profitability and productivity, integrating with other applications, and providing real-time business intelligence analytics.
Wrike
Wrike streamlines the internal project management and collaboration processes across teams. The platform focuses on the accomplishment of tasks rather than entire projects, offering workflow customization for companies to make processes more company- or industry-specific. It provides visibility into individual workloads to allow for better capacity planning—in Wrike’s workload view tool, for example, resource managers can check short- and long-term availability of individual team members.
monday.com
monday.com is a comprehensive platform that’s designed to help teams manage their entire workflow within a single digital workspace. It’s a project management software that helps to increase transparency and visibility within day-to-day operations, automates repetitive tasks, enhances team collaboration, and creates visibility in workflows. The solution helps you understand capacity requirements with its pre-made templates that account for all the different factors you need to track and manage to understand capacity.
Resource Guru
Resource Guru is a scalable solution that helps you manage resource complexities with automated functionalities. The solution allows you to more effectively manage your team’s time with features such as calendar integrations with Google Calendar and Microsoft Outlook, giving you greater visibility into schedules. It also lets you filter by skill sets, so you can create your dream team for each project.
Which Resource Capacity Planning Software Is Right for You?
Choosing the right capacity planning software depends on several factors, including your business needs, the size of your organization, and the type of projects you handle. While the eight capacity planning tools mentioned in this article are among the best in the market, it’s essential to evaluate each software’s features and functionality to determine which one is best suited for your digital agency.
While capacity planning can feel complex, remember that capacity planning software is an essential tool for digital agencies to use to optimize their resource allocation and forecasting. By providing insights into future resource needs, these tools enable digital agencies to allocate resources effectively, increase efficiency, and improve project management. If you’re selecting capacity planning software, it’s crucial to consider features such as real-time data visualization, automatic resource allocation, and “what-if” scenarios to make informed decisions based on the results.
And, as always, we’re here to help! The team at Parallax loves solving capacity and resourcing problems so that your business can stay competitive – and so you can focus on what truly matters: your people and the health of your business. We’re ready to chat when you are.
If you’ve been in the digital and development agency world for a while, you’ve likely experienced the struggles associated with growing – or even just sustaining – revenue. It often feels like you’re on a rollercoaster ride, where the business either has too much work and not enough people – or not enough work and too many people. This very easily happens when leaders lack reliable data and foresight into where the business is heading. You’re not alone in this struggle—we’re here to help you get off that ride.
Taking control over your revenue operations (or RevOps) with a few best practices is a sure way to start improving overall operational confidence because, when it’s done right, you gain the forward-looking insights you need to make smart decisions for the good of your people and your business.
We know RevOps can feel complicated, so we’re covering the ins and outs of it to help get you started…let’s dive in.
Implementing Straightforward Revenue Operations
Successful revenue operations require alignment across all major business functions in order to not just sustain revenue but drive it forward. While there are various ways to go about revenue operations, we’ve seen our clients gain control of performance and their ability to generate revenue by leveraging a few (relatively) straightforward steps.
First, plan to hit and adjust your revenue goals. This may feel obvious, but far too many organizations aren’t actually planning their revenue. Here are a few recommendations we have when building out your plan:
First, know there’s a difference between sales bookings and revenue: sales bookings refer to the value of orders or contracts that a company receives from customers, whereas revenue is the actual amount of money that a company earns from those orders or contracts after they are fulfilled, and payment is received. In other words, sales bookings represent potential revenue, while revenue represents actual earnings. We recommend estimating revenue (monthly and quarterly) for both existing work AND potential new business.
Coordinate across business functions to understand the intricacies of your funnel. What actually goes into winning new business? What needs to happen to retain customers or grow accounts? Everyone should be on the same page about the answers to these questions, as winning a new project or account doesn’t come without a cost (literally). It takes time and resources to develop outbound sales and marketing materials to catch the eye of prospects; it takes time and resources to conduct industry and competitive research and develop a stand-out proposal; it may even require travel to the prospect’s city in order to seal the deal. Account for everything that goes into securing and growing revenue.
Update actuals in your forecast and revenue plans every month. You can’t set it and forget it—treat it as a living, breathing plan that needs attention and care. This view signals when you need to course correct to hit your targets.
Second, review your pipeline every week. Yes, we said every week. Here’s how to go about it and what to look for:
Review, shape, and prioritize new business opportunities. Do new deal opportunities allow you to hit your revenue targets? It’s imperative for Leadership, Sales, and Delivery teams to be on the same page for which opportunities are best for the business, which can be supported with existing resources, and which will require new or more resources.
Use your weekly meeting to update account- and project-level revenue forecasts. Update close dates, start dates, and any mismatched deal values between the CRM and your strategic resourcing planning and forecasting tool (i.e., Parallax). Is everything running on time and within budget? Are any projects going off the rails, and if so, how does that impact revenue in the near- and long-term?
This step is key to avoiding things like revenue leakage – or, the loss of potential revenue that a company could have earned but did not. This usually happens due to errors or inefficiencies in the company’s processes (think: underbilling, over-discounting, uncollected fees, incorrect pricing) OR through intentional actions such as fraud or non-compliance with contracts or regulations. In either case, revenue leakage results in reduced profitability for the company and should be avoided at all costs.
Forecast renewal expansion revenue at least once a month. What’s the health status of existing projects and accounts? What’s in danger, and where is there room for growth? Don’t forget to take time every month to identify and assess key factors that may impact renewal and expansion rates, such as customer satisfaction, market conditions, and the competitive landscape.
Barriers to Revenue Operations
So, what’s standing in the way of confidence when it comes to revenue operations? Historically, agencies have built processes around the project lifecycle—everything has a beginning and an end; projects weren’t necessarily treated as something that could grow, expand, and become more valuable over time. But that’s all a thing of the past.
Digital agencies and development firms are different today. In most cases, leaders aren’t seeking out one-and-done projects and accounts. More than ever, leaders are looking for a balanced portfolio that includes clients and work that can grow and expand as their organization’s services and skills do. It’s a “let’s grow old together” mentality that creates strong relationships, fosters new opportunities, and lets both parties succeed and scale.
But to get there – to grow not only in services and skills but also in revenue – agencies need predictive and proactive tools that enable strategic, forward-looking decision-making. Only then can they start to overcome the various challenges today that tend to put a dent in operations (and revenue) and stress out leaders. What are the challenges associated with planning and forecasting revenue, exactly? It all comes back to having limited operational visibility. Without the right tools, we regularly see organizations struggle with:
Having a lack of data (or the right type of data) to track long-term revenue trends, make informed forecasts, or even understand the shifting landscape for customers, competitors, and markets
Inconsistent processes for revenue tracking and resource planning and forecasting – this tends to worsen when key stakeholders have difficulty aligning on business strategy
Outdated technology that creates limited ability to track and measure the effectiveness of forecasting methods and approaches
The biggest challenge, however, is trying to be too precise. Precision inevitably becomes a barrier to doing anything consistently because, well…it’s just too difficult and time consuming to try and estimate everything that will happen 10 weeks from now (even five weeks from now) down to the exact dollar or minute. So, we’re begging you: don’t let precision get in the way of the work. Know that adjustments will need to be made as you go—it’s all part of the process.
Benefits of Confident Revenue Operations
If you’re new to measuring the various factors related to revenue operations, we strongly advise keeping it simple to start. We outline various operational best practices for you here when you’re ready, but let’s focus on the sales pipeline and dive a little deeper into the importance of reviewing it every week.
First, know that it’s quite common for leaders to overreact to the situation at hand. If they’re too busy with existing work, they might stop focusing on securing new work. If there’s not enough in the pipeline, they might stop putting effort into resource planning. It’s a constant back-and-forth that catches everyone off guard.
But we know this to be true: reviewing the sales pipeline regularly helps to confirm what work you think will happen and when, providing the business with an up-to-date view that can inform more accurate revenue and capacity forecasting. Then, after conducting a variance analysis (i.e., what was planned vs. what actually happened), leaders gain a better understanding of agency performance, so they can proactively take action if needed—and teams can respond accordingly when there’s a predicted shortfall in incoming work as well.
Altogether, by responding to dips in the sales pipeline, rather than dips in workload, leaders are better poised to stabilize, even grow, revenue.
Other benefits agencies experience when they start to prioritize RevOps best practices:
Collaborative workflow: Leveraging a strategic resourcing planning and forecasting tool like Parallax helps create a collaborative workflow between business-critical applications to ensure reliable, real-time financial data is available for your RevOps conversations. Plus, Parallax has a team of experts ready to guide you in establishing the operational cadence that works best for your business, ensuring you have a hold on RevOps and don’t experience any surprises.
Shared perspective: The right tool will also provide a shared, future-looking perspective across your agency so that you don’t experience the pitfalls of misaligned perspectives such as a dip in revenue – not to mention internal frustration, stress, and tension. Instead, you always have a pulse on what lies ahead and where and when you need to course correct to ensure you can hit your revenue targets.
Confident decision-making: RevOps can be stressful for leaders when they don’t have the right insights to guide their decision-making process—but when you review and assess your forecasts and pipeline every week in just a few steps, uncertainty will be replaced with confidence. Leaders will know when to amp up new business efforts, for example, and when to hire and who to hire.
Ready to Revamp Your Revenue Operations?
RevOps best practices are all about combating the peaks and valleys tied to revenue that impact confidence and increase stress for leaders, who are attempting to sustain and grow their businesses.
Start by implementing a straightforward revenue operations and planning process – execute it weekly – and you’ll start to see those fears, uncertainties, and doubts dissipate. Questions about revenue operations or other operational best practices? These are some of our favorite topics to discuss! We’re ready to connect when you are.
Resource optimization is an essential but difficult best practice to nail down for services organizations because it’s an inherently dynamic industry we live in. The services wanted and needed today – paired with the talent and resources required to deliver those services – is always. in. flux. It’s what makes the services world exciting, but it’s also what makes it really challenging. Without the right solution, resource managers can experience limited control, lack of predictability, and a feast or famine mentality, and it’s exhausting. You don’t like this, and we don’t like this for you.
Stick around and learn how the right platform can help leaders and resource managers avoid common resourcing challenges and instead feel empowered to effectively manage each day and accurately forecast for the days ahead.
Professional services automation (PSA) is a category of software that provides various functionalities needed to manage core processes and operations within services businesses, such as agencies and software development shops. PSA solutions streamline workflows, increase visibility, and enable greater efficiency for services organizations by providing a variety of project management, resource optimization, time tracking, expense management, revenue tracking, and forecasting capabilities. Some PSA solutions integrate with business-critical applications, such as accounting software and CRMs, to allow for seamless orchestration between best-in-class tools while encouraging best practices across business functions, while others simply look to replace those tools with an all-in-one approach.
At Parallax, we believe that PSA platforms and other comparable solutions should be built to keep teams in the tools they already love (or help eliminate the ones they don’t love!) while providing holistic, real-time insights into the business. They should always enable better, faster decision-making that drives strategic performance.
The benefits of using PSA software for resource optimization
Services businesses – where people are the product – spend a lot of time coordinating day-to-day management of resources. It often feels like a never-ending game of Tetris, with leaders and resource managers attempting to put the best people on a project that matches the project needs, while also trying to maximize utilization for everyone. Those two motivations rarely line up perfectly, and it’s that conflict that makes resource optimization incredibly time consuming and challenging to get “right.”
But when they do get it right, leaders understand what skill sets their current employees have and what services they can deliver today and tomorrow, with all relevant information typically held and managed within PSA software. Modern solutions not only help streamline resource management but level up these core business processes into resource optimization.
Here’s what services businesses gain when they adopt a top-of-the-line solution:
Greater visibility into sales pipeline
PSA software and other similar solutions should provide access to sales pipeline data to enable better resource optimization. Without visibility into the pipeline, leaders can’t know what’s being sold, whether those opportunities are enough to hit financial and operational targets, and if they have the right people available to do the work. Importantly, services companies need to ensure sales pipeline information is regularly updated, too, so that their data can provide directionally-correct insights early on and add higher fidelity along the way.
More streamlined capacity planning
To optimize resources, leaders must also plan for capacity — this can and should happen within the PSA solution, too. Capacity planning essentially helps leaders “read the tea leaves” earlier by planning for future demand based on social, cultural, and industry trends. This helps them understand how customer demand has changed and impacted the value of the services they currently offer, , AND assess the future of the services they may want to invest in based on industry direction and customer demand.
Fewer disruptions to workflows
Consider the cost, time, resources, and implementations that it takes to replace everything in the tech stack versus the quick wins services companies can achieve by integrating PSA software with their existing toolset. Solutions that have native integrations for the best-in-class tools organizations already use help to avoid disruption to workflows, which helps to avoid unexpected changes to resourcing plans — and ultimately helps to deliver value quickly. The best kind of win-win-win.
Reliable forward-looking insights
PSA software that allows for real-time resource planning unlocks actionable, meaningful forecasts that 1) enable proactive decision-making 2) provide teams with more growth opportunities and 3) ease the stress and anxiety that leaders often associate with resource management. By removing outdated resourcing methods and implementing best practices for tried-and-trueresource optimization, services companies can focus on continuously optimizing operations, evolving their service offerings and driving growth.
A shared source of truth
We know everyone just loooves spreadsheets (ha, ha…), but it’s time to ditch the training wheels. Today’s solutions should replace clunky spreadsheets that are used to fill the gaps between the different functions of a services business and instead provide reliable data and actionable insights, all in one place. By curating critical data with a resource management AND planning engine (like Parallax ), services companies get a better source of truth on how the business is performing. Leaders can then free up their valuable (and very limited) time to make smart and future-looking resourcing decisions based on a shared view of data vs. gut instinct.
3 key features to look for in PSA software
Integration-first
Legacy PSA platforms and monolithic ERPs force project and delivery teams to use sub-optimal tools for project management and resource planning, often creating a significant learning curve and administrative burden for teams. And we all know no one wants to rip-and-replace their current systems and platforms, as it can cause significant disruption to daily operations. Think of how you would want to spend the next 12-18 months for a moment… learning how to use tools to do things you already know how to do, like time tracking and project management, OR spending that time (and money) learning best practices that will help you optimize operations, maximize utilization and grow your business and people? We know what we’d choose.
Solutions with an integrations-first approach don’t take away valuable time or add on unnecessary administrative work to people’s days but instead broaden the power of an organization’s toolset. Integration-first solutions empower teams with the tools they already use while optimizing operations for better performance… an operational leader’s dream!
Enhanced visibility
PSA platforms should create enhanced visibility into resource assignments across projects, teams, and accounts in real-time, allowing resource managers and team leads to determine planned capacity and resource needs with certainty. With the right platform, they’re able to quickly evaluate workloads, make real-time adjustments to maintain higher utilization and team engagement, and match the best resources to the right projects for optimal team performance.
Reliable forecasting
Purpose-built platforms enable leaders to make smart, proactive decisions in support of their business and people. The solution they’re using to manage resources should also provide them with reliable, real-time insights that inform forecasts. This combination – real-time forecasting and smarter resource planning – provides a view into how the business is performing on a variety of financial and operational metrics and enables leaders to project future performance as well. The key here is that these forecasts are actionable. It’s information that leaders can actually use to make informed decisions about their business and people. Having it at their fingertips means they spend less time gathering information and making half-baked predictions and more time trusting the data and taking confident action.
5 Best PSA software platforms for resource optimization
Services companies have a ton of options today for the platforms they use for resource optimization. While every business will have a unique set of requirements and a specific wish-list for what they want from their platform, it’s important for everyone to be able to have smooth, streamlined workflows that allow them to take their resource management processes to the next level.
When in doubt, look for a tool that’s a force multiplier, allowing the business to shift from a heroic organization to one that’s future-forward and teed up for steady, streamlined growth. Which brings us to…
Parallax
Effectively managing resources requires finding the right cadence and leveraging best practices so that it becomes second nature to everyone involved. Once service companies find that sweet spot, they experience better utilization rates, higher margins, and a happier more engaged workforce.
Parallax is built with that sweet spot in mind. It’s a solution designed by a team of industry experts who have lived the challenges of resource management and know the joy of achieving resource optimization. That’s why Parallax leverages a different approach than other platforms on the market—it’s a purpose-built platform for services companies, including software development firms, full service digital agencies, digital marketing companies, and technology consultancies, and has native integrations for the best-in-class tools that are already in use. This provides fewer disruptions to current workflows as well as a forward-looking view into the business to enable better resource management, tighter operations, and stronger performance.
Parallax turns resource management into quality resource planning that results in accurate, confident forecasting – meaning everyone from leadership and finance to resource planners and project managers benefit from the platform. Plus, it delivers value quickly, driving adoption and implementation in 90 days or less, and locks in price from the very beginning, even if more users along the way.
Parallax is a solution that empowers growth-minded organizations with greater transparency across the business and helps leaders free up their time spent in spreadsheets so they can focus on what truly matters: setting vision, delivering great work, inspiring their teams, and growing the business.
Kantata (Mavenlink)
Formerly Mavenlink and Kimble, Kantata is a PSA platform that centralizes operations and tools into one core solution to help services organizations optimize their resource planning and decision making. By offering an all-in-one automation solution or integrating components of existing tools, Kantata helps organizations view and forecast their utilization and make data-driven decisions. The platform allows users to more easily balance supply and demand, explore impact to revenue and margin, configure resource recommendations, align skills with project demands, and more. It’s designed for creative and consulting firms as well as IT and software shops.
In order to get the most out of the Kantata platform, users are encouraged to migrate data from existing systems and adopt their tools and processes, meaning implementation can take twelve months or longer.
Projector PSA (BigTime)
BigTime Software’s Projector PSA is a cloud-based, best-of-breed PSA solution for services organizations. It’s designed to manage and optimize operations for users, allowing them to experience improved project performance, optimized resourcing, and higher profits. Its resource scheduling software “balances the art and science of resource management” by allowing project managers to easily match skills to profiles and review information regarding hiring, utilization, forecasts, and profitability.
Its foundation caters to various operational elements, including time and expense management, project budgeting, invoicing, subcontractor management, rate and revenue management, revenue recognition, financial reporting, and more. Projector targets various industries, including software and high tech, accounting firms, creative agencies, architecture and engineering firms, and more.
OpenAir
An extension of Oracle’s NetSuit ERP, OpernAir is an all-in-one cloud-based professional services automation platform for a wide array of services businesses, such as IT services, advertising and digital marketing agencies, and other professional services organizations. The platform provides integrated time tracking, project management, resource management, expense tracking, and invoicing – offering a single platform to run a services organization. Its capabilities focus on achieving optimized resource management, improved project profitability, complete project financials, increased productivity, and greater insights and monitoring.
OpenAir’s thousands of global customers all use the same version and codebase, with options for configurability and customization. Migration and adoption of this all-in-one ERP platform can often take 6-12 months to fully implement.
Teamwork
Teamwork is a project management tool centered around collaboration and delivering work on time and on budget. It makes resource management simple by providing a view of everything in one place for the team, clients, and freelancers. Teamwork has advanced features for time tracking, budgeting, and resource allocation. It integrates with companies’ other project applications, such as the CRM platform, and automates repetitive tasks with straightforward workflows.
Teamwork targets agencies, professional services, and creative teams who want to gain visibility into performance and profitability, more easily manage financials, and address challenges before they cause problems.
How to choose the best PSA software for your organization
There’s nothing worse than researching platforms, implementing the “one” you think will be best for your business, and then experiencing disappointing adoption and/or frustrating features.
We want to help you avoid this. The right combination of tools – the best combination of tools – will enable forward-thinking resource planning and optimization, which creates a significant impact for the business. When you know when and where your people are spending time, you’ll know how and when you’ll earn revenue from that work. When you know how your team is utilized, you’ll know your costs and how much you’ll earn—and you’ll know your margins and can focus on hitting those targets. With these inputs, all delivered through better resource planning and active forecasting, you’ll be able to make smarter business decisions and improve performance.
Your solution should tell you if you have enough revenue to support your team, whether you need to hire, if and when to take on new work, and the impact deals will have capacity and utilization. It should take the guesswork out of operations so you can focus on your craft, your people, and the growth of your business.
Keep this in mind when you’re choosing a strategic platform that’s best for your organization—because if the solution you’re considering doesn’t help you achieve all of this, it’s probably not for you.
Let’s chat!
At Parallax, we know that services businesses need to move fast and move smart—and they need a platform that provides greater visibility and predictability, enables stronger adoption across the toolset, and provides better insights to inform resource optimization and strategic planning, all with fewer disruptions to the team’s workflow.
We know your world because we’ve lived it, too. We have tools and experts ready, willing, and able to help you tackle unnecessary resource optimization challenges and prepare the business for the next stage of growth.