How Digital Services Succeed: The Employee Utilization Rate Fallacy
There are over 60,000 digital services companies in North America. What sets these organizations apart from one another? The caliber of their craft, methods, and people. But when it comes to how they run their businesses, they are more alike than different. For example, many companies use employee utilization rate the wrong way. Here, we dive further into this concern and what you can do to improve.
Table of Contents
- Hitting the Stuck Point as a Professional Services Company
- How to Measure Employee Utilization Rate the Right Way
- Best Practices for Tracking Employee Utilization Rate
- Professional Services Utilization Benchmarks
This guide is the first in a series about best practices for professional services sales and operations. In this series, we share our own experiences running digital services companies as well as the knowledge of leaders from over 90 other digital services across the US. Be sure to check out Part Two: Project Margin and Part Three: Revenue.

Hitting the Stuck Point as a Professional Services Company
One of the most common shared experiences that digital services firms face is hitting a stuck point in growth—when it becomes difficult to scale the magic that made them great when they were small. For many, this happens when they reach about 25-50 employees.
These businesses enjoy early success because of their talented teams, quality of work, and great reputations. As word of their solid reputation spreads, the number of new business opportunities increases.
These service companies take advantage of these opportunities as they materialize and tend to be reactive when it comes to project planning and resource management. They just figure out how to make it work.
This opportunistic and reactive nature that we refer to as the Heroic phase of growth is exciting. Service companies of this size can typically rely on the chemistry of their team and gut instinct to make business decisions. But, this often leads to less-than-ideal performance related to metrics like utilization, project margin, and year-over-year revenue growth.
To move to the next phase of growth, which we call Operational, these companies need to develop a more measured and consistent approach to selling and delivering their work. To do this well, they need accurate data that is consistent, accessible, and easily shared. The operational improvements they make by using this data will show in their improved KPIs. We illustrate this growth trajectory using the model below.
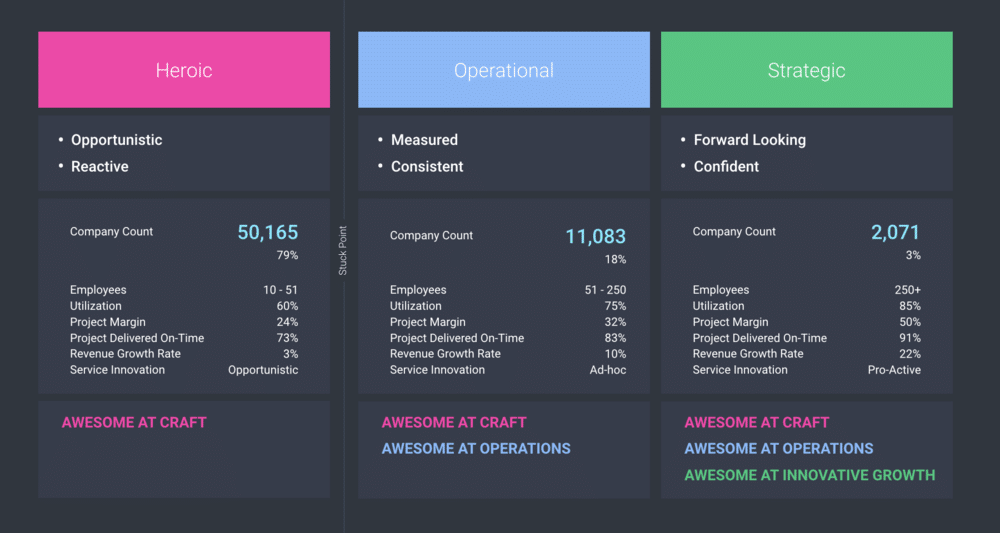
Our team adapted this model from SPI’s PS Maturity Model™, which helps organizations use benchmarking to improve their profitability, performance, and growth. We subscribe to and respect this industry-standard model, and recommend all professional services organizations reference it.
We culled down the insights from SPI’s model to create a version that speaks directly to the unique challenges of digital agencies. Only after digital service firms master their operations can they move to the Strategic phase.
What allows these firms to be strategic, forward-looking, and bet on innovation, is that they have achieved a level of operational excellence that allows for easy collaboration and coordination across teams.
They have data governance and processes in place that enable their teams to work autonomously while still supporting the overarching goals of the organization. Their excellence shows in their industry-leading KPIs.
Adopting Best Practices to Overcome the Stuck Point
When we present this growth model to business owners and operators, it resonates. They feel less alone. But beyond it being cathartic, they want to know what they can actually do to overcome the stuck point and scale. They know they need to get better at operations. But how?
It starts with knowing where to start and to focus. This can feel daunting, but it doesn’t have to be. You don’t need to boil the ocean. Using research and feedback from our PAC, we developed recommendations on the best practices to focus on first, how to measure key organizational metrics, and how to adopt the behaviors necessary to improve.
The first step? Learning how to measure employee utilization rate the right way.
How to Measure Employee Utilization Rate the Right Way
Utilization is an important metric that many digital shops are already tracking and measuring. It’s important, but it’s a lagging indicator of how good you are at proactive planning and goal setting—not necessarily how good you are at resource management.
Business leaders often use utilization in the wrong way. Many leaders look at utilization every week. They review utilization, and then they react—asking team leads to push their people or police how they’re spending their time. Or, they lean on account leads to pull additional business out of thin air.
Reacting weekly to utilization is not only ineffective for strategic planning, but it can also hurt morale. Employees can become disengaged, dissatisfied, and resentful if leaders focus on utilization alone. In these cases, the team leads ask employees to focus on hitting billable hours over anything else, when instead, they should encourage employees to focus on how best to deliver value.
A leader’s job is to ensure that the team has enough work opportunities for employees to stay busy and deliver value. Business leaders also often fall into the trap of trying to maximize utilization as much as possible. In reality, driving utilization too high can lead to even more detrimental effects on employee morale and the business.
Using Employee Utilization Rate as an Indication of Good Planning
To improve utilization, there are leading indications of good planning organizations can track. These indicators include:
- Planned backlog compared to capacity by role: Your planned backlog is how much sold work you have in the queue. Compare your planned backlog to the total capacity for each role. This metric helps you determine how much of each employee’s capacity you can expect to fill based on the work you’ve sold.
- Forecasted pipeline compared to capacity by role: Your forecasted pipeline is how much prospective work you have in sales opportunities. Compare your forecasted pipeline to the total capacity for each role. This metric helps you determine how much of each employee’s capacity you can expect to fill based on the work that might sell.
- Planned utilization compared to quarterly target: Planned utilization combines both the planned backlog and forecasted pipeline. Compare your planned utilization to your quarterly utilization target—ideally for each role in your organization. This metric helps to determine if the sales opportunities in your pipeline are sufficient to meet your quarterly utilization target.
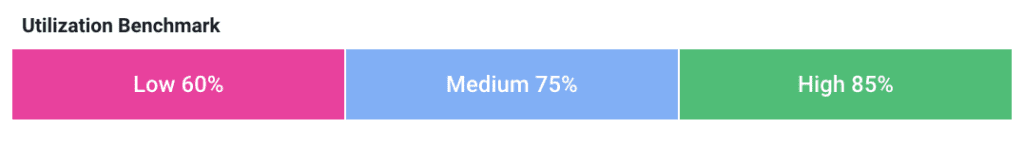
Benchmarks indicate that the highest-performing professional services organizations have an average utilization rate of 75-85%. We’ll review these benchmarks in more detail below.
Best Practices for Tracking Employee Utilization Rate
To track employee utilization rate effectively, organizations must develop the following behaviors.
Project-Level Resource Planning Governance (Weekly)
Updating resource plans every week should be a process that every digital services company adopts. Given how often resource plans change, if they aren’t updated weekly, planned utilization will be incorrect. Project managers need to review and update resource plans every week to ensure they reflect reality.
Timesheet Governance (Weekly)
There’s often a shared distaste for timesheets across organizations. This dislike is often a result of employees not understanding the value of them, especially at the individual employee level. Timesheets are not about keeping tabs on employees. Instead, they help the business identify when it needs to bring on more work to keep people busy, engaged, and employed.
It’s critical to communicate this value to employees and adopt a weekly process that verifies that all timesheets from the week are complete. Information from timesheets is a crucial input in determining each employee’s utilization, which impacts planned utilization.
Capacity and Capability Review (Monthly)
Delivery leaders should also establish a regular cadence for when they review the metrics detailed above. Most importantly, they should evaluate planned utilization against their targets. If planned utilization is low, delivery leaders should discuss what they can do to impact the sales pipeline to generate new opportunities.
Professional Services Utilization Benchmarks
In addition to tracking and measuring utilization, we also recommend that these companies compare how they’re doing compared to other organizations using professional services utilization benchmarks.
As we mentioned above, industry benchmarks indicate that the highest-performing professional services organizations have an average utilization rate of 75-85%. Comparatively, digital agencies and custom development shops in the Heroic stage of growth often find themselves with utilization rates around 60%, while Operational organizations see closer to 75% and Strategic, 85%.
Adopting the data governance and processes that we outlined above, you can not only work toward improving your utilization metrics but advancing to the next stage of growth.
Getting Started Is the Hardest Part
Utilization is a useful metric for evaluating how well you’re planning, and how well you’re making progress toward those plans.
To plan well, service organizations must have employee utilization rate targets they measure against. Tracking progress toward these targets isn’t as hard as most business leaders anticipate—it simply requires you to get started with adopting the best practices detailed above.
If the metrics and best practices we shared in this post were helpful and sparked ideas for developing better data governance habits, please subscribe to our email newsletter to get more insights delivered straight to your inbox.