KPIs that Matter: How to Hit Your Utilization Target
We covered why utilization and project margin are the two most important KPIs that digital services organizations need to prioritize. We went a little deeper into how to protect project margins during economic uncertainty, and now, let’s explore how to drive utilization without burning out your teams.

Digital services organizations have a mountain of priorities, from delivering projects to winning new business and growing the team. One critical component to doing all of this successfully is understanding the organization’s utilization benchmark, and planning the business to consistently hit that target.
Utilization – one of the two key metrics that matter most – is a measurement of a team member’s total time spent on billable projects versus the total billable time available. High utilization indicates that an organization is efficiently using the capacity of its team, meaning team members are meeting or exceeding their billability targets. Low utilization means team members aren’t meeting their billability targets and have available time to dedicate to projects.
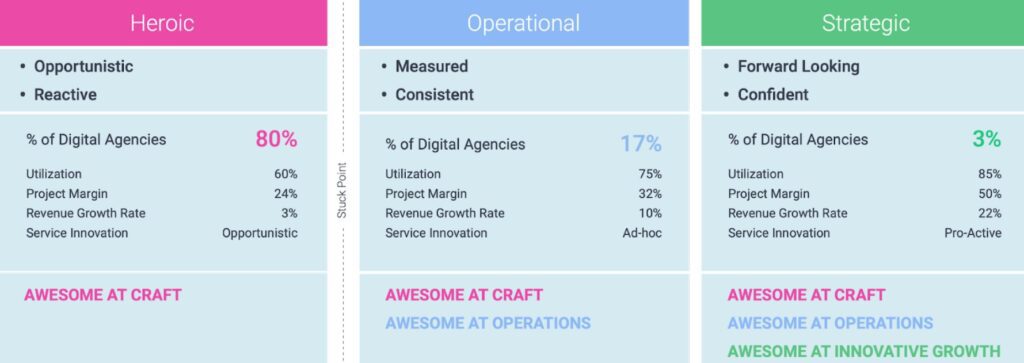
Every organization is tasked with optimizing and stabilizing utilization. While pushing utilization higher and higher may seem great from a financial perspective, it is likely to result in team burnout and isn’t sustainable over time. When utilization drops too low, it means the team is losing out on additional revenue opportunity, which limits organizations from maximizing their financial potential. Having a clear view of utilization is important – in fact, it’s critical – to moving up the maturity model from a heroic organization to a strategic business.
Utilization 101: Let’s cover the basics
One big, consistent challenge for delivery leads is managing performance expectations from sales and leadership without overworking their teams or losing resources to attrition. They need to get ahead of issues like low or high utilization, and having a confident sense of current and future utilization is a key metric they need to watch. To do so, they need the right toolset and operations cadence to effectively track utilization and easily report across the organization. This is a tall order, especially if the business is unclear on its utilization benchmark.
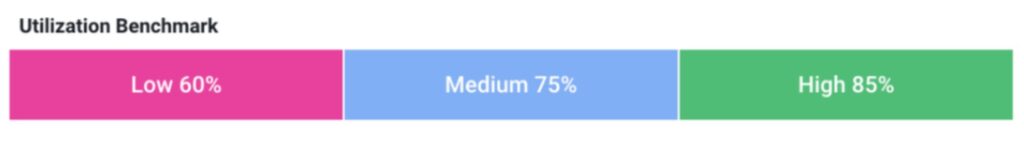
When we say utilization benchmark, we’re talking about that “sweet spot.” Every organization will be different – and every role will be different – but generally, you should aim to be as close to 100% without burning people out. This typically translates to a target benchmark of around 75–85%, leaving room for team members to complete admin work, jump in on new or quick-turn projects as they arise, or support company-specific initiatives while still allocating the majority of their time to billable projects.
Importantly, leaders need to be careful not to put too much emphasis on utilization on a daily or weekly basis, as employees can become disengaged, dissatisfied, and resentful if leaders focus on just that. Team leads should encourage employees to focus on how best to deliver value while promoting the benefits of healthy utilization at all levels of the organization.
How to identify the root causes of utilization challenges
We already covered how to identify the root causes of poor margin performance (i.e., sales oversight, resourcing misalignment, unrealistic project expectations), now let’s do the same for utilization! Challenges with utilization can be attributed to one (or both) of two root causes:
- Poor capacity planning and resource forecasting
- Misalignment between resource management and delivery
Read on to dive further into the attributes of each root cause and how to successfully address them.
Root challenge #1: There’s a capacity planning and resource forecasting problem.
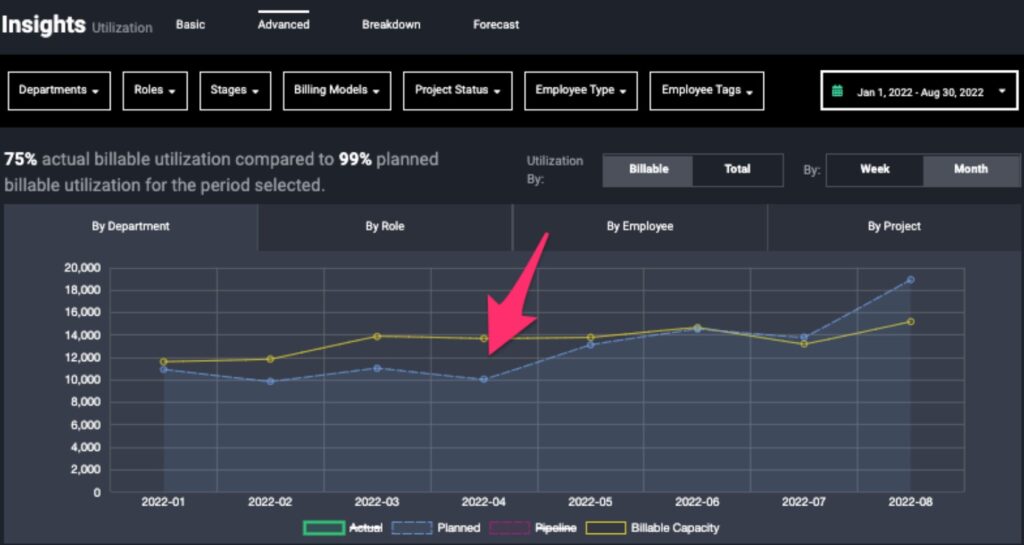
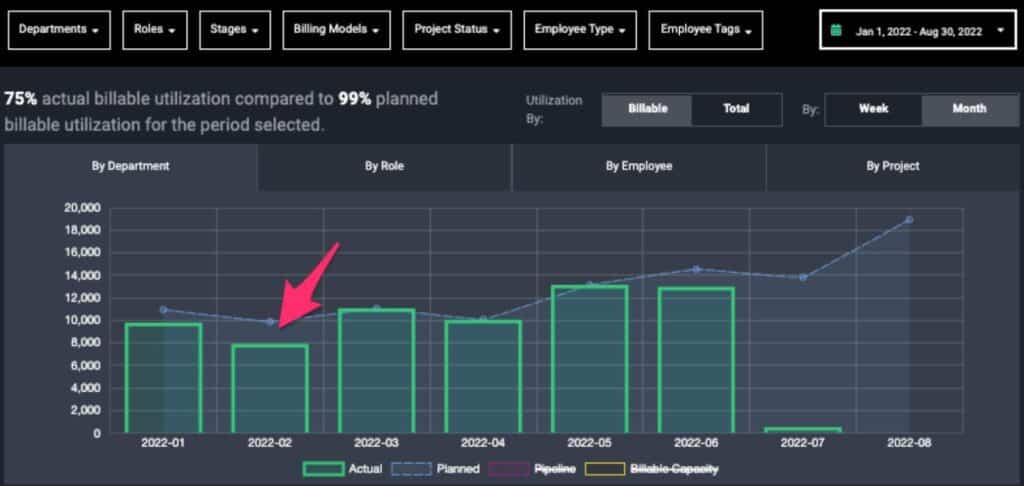
If your utilization rates are off, your supply versus demand forecasting process might be broken. In Parallax, this would appear in utilization reporting as such: If utilization is too low, you will have more billable capacity than you have work to deliver (blue line), and if it’s too high, you’ll have more work to deliver than billable capacity. This discrepancy will show up in analysis that compares total planned hours (blue line) versus total billable capacity (yellow line).
If digital services companies are consistently missing their utilization benchmark, one of these capacity and resource forecasting challenges could be the culprit:
The team closed less new business than expected (less demand).
- Challenge: How can you get more precise with sales forecasting so that you can more accurately predict the demand for resources being generated by your pipeline? Are you losing deals because your prices are too high compared to your competitors? (This would likely show up in your performance metrics as high project margin % and low utilization.)
- Solution: Sell more work to new customers. This is the most obvious fix if you have more capacity than you do work. When you bring in more projects, you’re going to increase demand for your team members, and your supply and demand will naturally start to more closely align.
The team forecasted less work with your existing customers than you expected (less demand).
- Challenge: Forecasting business with your existing customers is just as important as it is for new business. You need a clear understanding of both to inform your resourcing plan and help balance utilization rates.
- Solution: Proactively forecast work for your existing customers. By better forecasting work with your current customers, you’ll find a clearer picture of team capacity in the coming months.
Growing the team too quickly (too much supply).
- Challenge: Maybe you have exactly as much business as you expected and you’re still experiencing lower than expected Utilization. Have you hired new team members recently? You may have hired additional team members too soon and inflated your capacity when you did not have the work forecasted to meet that capacity.
- Solution: Use data-driven methodologies to facilitate conversations around growing the team. Within Parallax, you can easily access the data required to determine when and for which roles you need to hire.
Root challenge #2: The delivery team is delivering less work than was scoped and planned.
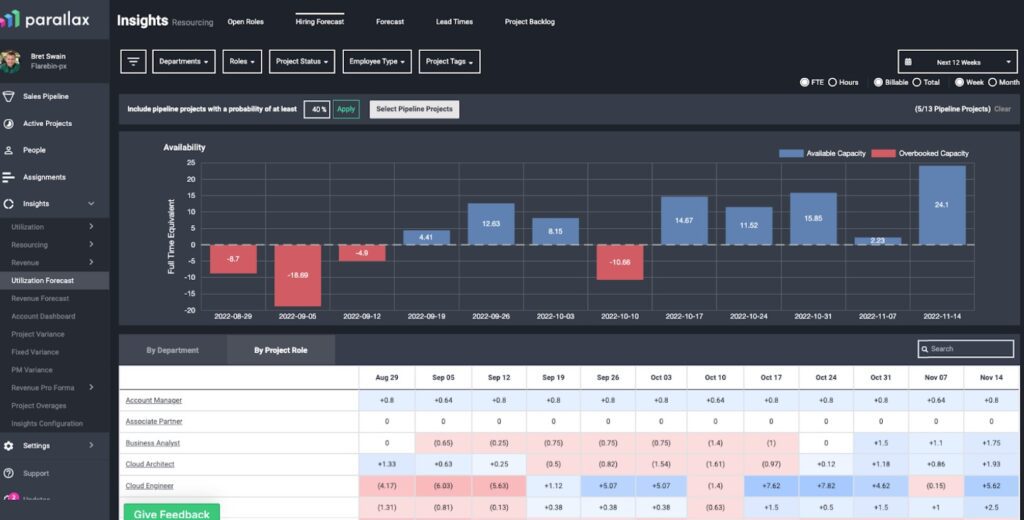
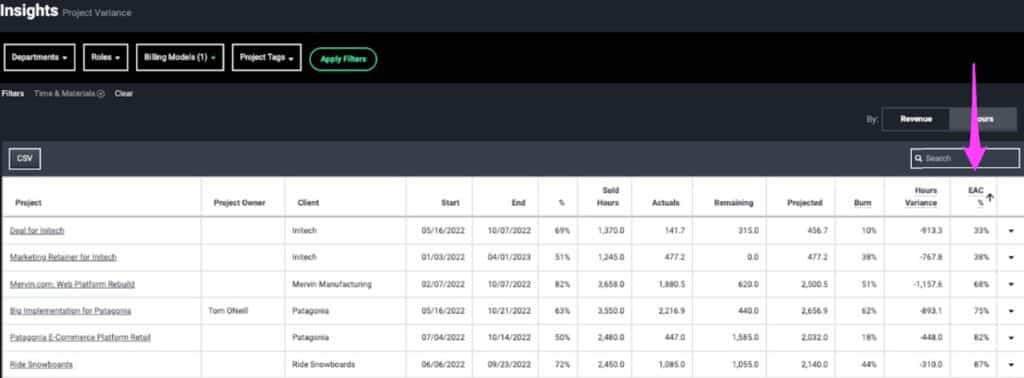
Alternatively, if there is no discrepancy between planned hours for the team and their total billable capacity, the issue likely might be that your delivery team is actualizing fewer hours than what was originally scoped and/or planned. Things like revenue leakage or even over-efficient delivery can cause utilization dips. This is what that looks like in Parallax:
And here are some reasons that could happen:
Revenue leakage.
- Challenge: The team billed fewer hours than what was budgeted for a time and materials (T&M) project. In this scenario, the team is leaving money on the table, and utilization (as well as revenue) will suffer as a result.
- Solution: Burn Against Budget Projections, often referred to as “Estimate at Complete” (EAC), should be used to understand where the team is expected to land in terms of burn against budget for a project. For T&M projects, a low EAC means that the team is forecasted to burn fewer hours than expected and miss the opportunity to bill for pre-budgeted hours.
Efficient delivery (i.e., fixed-fee projects).
- Challenge: The team is delivering fixed-fee projects more efficiently than expected, which is great! However, this is causing gaps in utilization that need to be addressed.
- Solution: Keep the fixed-fee rates the same if the service is selling well, and decrease your hour estimates for those projects to reflect the effort that’s truly required. The team would then be able to spend that saved time working on other billable work and generating more revenue for the business.
Delayed delivery.
- Challenge: Delayed projects prevented the team from working on the projects that they had originally planned to be working on.
- Solution: Easier said than done … BUT, proactively identifying and mitigating project risks that might prevent your team from working on billable work during the expected time period can solve this challenge. Additionally, when this does happen and can’t be avoided, scan the rest of your projects to understand if those team members could instead bill to other projects during the project delay.
Closing the gap
Simply understanding the delta between planned work and total billable capacity gives confidence and power back to delivery team leads who are tasked with hitting this benchmark. Luckily, the right resourcing tool can make this entire process seamless and stress-free.
Before, with disparate spreadsheets and tracking processes, delivery leads could be left pulling utilization and capacity data from all over the place, which becomes a very manual, time-consuming process – and worse yet, it’s a reactive activity… if it’s done at all. With Parallax, tracking utilization becomes a proactive process as all necessary data already lives within the platform, thanks to our integration capabilities. Reporting becomes automated, and with just a few clicks, our customers can view real-time utilization metrics and forecasted utilization from one central source, and proactively address any expected speed bumps.
Let’s chat
We understand that there’s a lot that goes into tracking both utilization and project margin, and when economic uncertainty continues to rear its head, it can feel overwhelming. Not to worry, though—we’re here to help.
What’s key to remember is that you shouldn’t hyper-fixate on just one of these metrics, otherwise the other one will suffer. If you want to scale your business in a healthy way, we highly recommend prioritizing utilization AND project margin together, as they naturally fuel scalable revenue growth. It’s the flywheel for success with digital services organizations.
Reach out to learn more about how Parallax can empower you and your teams with the insights you need to navigate whatever comes your way.
Want to learn more about utilization? Check out our Founder and CEO Tom O’Neill’s previous blog! He covers best practices for tracking utilization metrics effectively, how forecasting can help better predict utilization and more.