In this article, we will discuss the importance of decoupling resource and project management in digital services companies to create more efficient processes and prevent burnout. We’ll explore the pitfalls of task-based planning and the advantages of implementing a duration-based approach.
Key Takeaways:
- Task-based planning is difficult to scale and too granular for growing digital services companies, leading to inefficiencies and burnout.
- Duration-based planning reduces context-switching time, saves costs, and eases timesheet stress.
- Decoupling resource and project management leads to more streamlined operations, shared responsibility, and fewer surprises, enabling companies to scale more effectively.
- Parallax, a resource planning tool, supports duration-based planning and helps project managers and resource managers collaborate for more successful projects.
There are a million factors to consider and align on when scaling a digital services company. Far too often, as these companies expand their teams, processes and systems quickly become fragmented and muddled. The work itself starts to feel more like a game of Tetris than a strategy.
The people who bear the brunt of fragmented processes are the project managers who are expected to be the central hub for the team, resources, projects, and individual tasks.
Project managers must balance resource and project management. They’re held accountable when timelines aren’t on track and are expected to have the expertise to understand how a project is progressing. They’re also on the hook for project health assessments based on the burn-down in tasks and the burn-down in budget. In other words, it’s a lot.
As a company grows, the combination of a traditional task-based approach for project management and resource planning leaves project managers with a next-to-impossible role.
They’re expected to not only keep all the plates spinning within complex projects that often have hundreds of tasks or points (if not more), but they also have to figure out how to allocate human resources for future work. It’s simply not scalable.
How about—and just hear us out—we don’t break our beloved project managers? Let’s dive into our recommendations for successfully scaling your business without burning out project managers or anyone else within your organization.
Table of Contents
The Pitfalls of Task-Based Planning
First, let’s cover task-based planning and pricing. This is when teams break down each project into a series of tasks and subtasks and estimate how much time it will take people to complete each task.
They then assign a fee to each task based on the billable rate of the person assigned to it. Finally, they total everything up to determine the overall project budget.
This might sound standard, but in practice, task-based management is a dated approach that comes with various challenges for digital services companies.
It’s Difficult to Scale
In the early stages of a company, it’s easy to have a small group of people share the responsibility for a small body of work. Each person has a sense of responsibility, and everyone is pitching in when it comes to dividing and conquering the work.
Shifting that responsibility across larger teams and more clients, however, can be difficult. Again, this leaves project managers to manage complex projects and tasks, while also figuring out future resourcing needs. It’s far too much ownership and responsibility for one role.
It’s Too Granular
Task-based workflows are incredibly time-consuming because they focus on individual tasks at a granular level and in 15-minute increments of time.
When the client list starts to expand—or the project size starts to grow—there can be hundreds of individual contributors and a lot of overhead and time to rigidly manage if everyone’s tasks are tracked in small increments.
Plus, this typically goes against the grain of creative practitioners. Don’t expect them to happily bounce through hundreds of small tasks in 15-minute allotments with peak creativity for each.
It Doesn’t Account for Context Switching
It’s difficult for a project to land perfectly on budget through a rigid task-by-task approach, as it quickly becomes expensive for individual contributors to switch between projects.
The often unexpected, unaccounted cost for context switching across six or seven different projects and clients tends to kill some of the time allocated for each task. Designers or developers, for example, might have to spend 15-30 minutes getting back up to speed when they switch from one project to another, and they’re doing this multiple times a day.
That time has to go somewhere. It’s either chipping away from their work time, or it ends up killing the budget. This forces teams to eat the overages (sacrificing margin) or increase client budgets. Neither is ideal.
The Solution: Duration-Based Planning
In place of task-based planning, digital services companies should implement duration-based planning. This is when a certain percentage of each role or a person’s time is allotted to client projects.
Rather than assigning a certain amount of time for each task, duration-based management assumes the employee will spend, for example, 50% of their time on a project for client C and 50% on client D.
The expectation is that the employee will complete all the tasks they’re responsible for during that time, and communicate with their manager or project owner if they need a longer window. Project managers can still manage the individual tasks or points that need to be addressed and completed, but budgets are not dictated based on the roll-up of the small allocations of time across all of these individual elements.
We highly recommend that people only work on two or three clients in a day, otherwise they’re too easily bogged down by checklists and short-sighted tasks that break the budget.
Say someone is assigned 30 tasks (or points), and the sum of the hours on all those items is 200 hours. That person has 200 hours of billable work to complete within perfectly timed tasks that are aligned with the budget.
Again, what about the time it takes for context switching? Where does this person put the time it takes to ramp up on each new task if they’re juggling more than two or three clients? That extra time impacts the budget.
However, with a duration-based planning approach, companies significantly reduce context-switching time. They can start being more thoughtful about how time is spent—and ultimately set their teams up to win.
Additional Benefits of Duration-Based Planning
There are other benefits of the duration-based approach beyond cost and time savings. A large portion of today’s workforce is feeling burnt out. This feeling is exacerbated within digital services companies that often have an always-on mentality.
Essentially, everyone is working way harder than they should be, but it’s not always reflected in their timesheets. Developers, designers, and other individual contributors could be feeling overworked and stressed out, yet their billable utilization could say 60%.
With a task-based approach, these individuals are likely to hide time to avoid the backlash from project managers for going over the allotted time and budget. It’s a lose-lose situation for both the contributor and the project manager. This type of environment eventually impacts a company’s attrition rate. However, a duration-based planning approach can help ease that timesheet stress.
The Importance of Decoupling Resource and Project Management
Duration-based planning is a step in the right direction, but digital services companies should also be decoupling resource and project management. They should sell and plan work based on duration, not tasks, and create more checks and balances as projects are in flight to set project managers up for success and help teams stay on track.
When these two operational elements are conflated, teams become heavily reliant on the project manager, expecting them to be a unicorn who can estimate time and budget for the work and hold people accountable to those estimates.
Unfortunately, there’s rarely a discussion at the end of the week to assess how many tasks are left versus how much time and budget is left in the resource plan. If those weekly checkpoints don’t occur, there are often surprises as projects wrap up.
For example, you may find that teams are frustrated, budgets have been blown, or deliverables have fallen short. On the other hand, a micromanagement approach to ensure everything and everyone is on track is not sustainable for project managers or scalable for the business. Strong talent will burn out quickly, and employees will likely search for a new role or a new company sooner rather than later.
An Example of Decoupling Resource and Project Management
Here’s what it can look like when project management and resource planning are decoupled. The project manager sets expectations for three team members to work 50% of their time on the project from date A to date B.
There’s a clear expectation and agreement that these team members can complete their tasks in that period of time. The project manager checks at least once a week to see which tasks are completed and which tasks are coming up. They will also regularly assess if the tasks left are reasonable for the time and budget left.
This checks/balances approach essentially creates a mechanism for greater visibility and consistency, shared responsibility, reduced tension, and fewer surprises. Ideally, there would also be someone (i.e., a resource manager) for the project manager to partner with who can own resource adjustments for the project as needed, so the project manager can remain focused on the project itself.
With this approach, digital services organizations can scale easily and start to operate at a more mature, streamlined level that doesn’t break their people. To do this, you must adopt a duration-based project approach and decouple project management and resource planning.
Improve Project Management & Scale Your Business With Parallax
We’re passionate about this because we’ve lived it. We believe duration-based planning is a best practice for operationally mature organizations. Duration-based resource planning helps teams stay focused on a few projects at a time while delivering more value to clients. As a result, resource managers can easily visualize resource allocation and project managers can deliver more value. It’s truly a win-win.
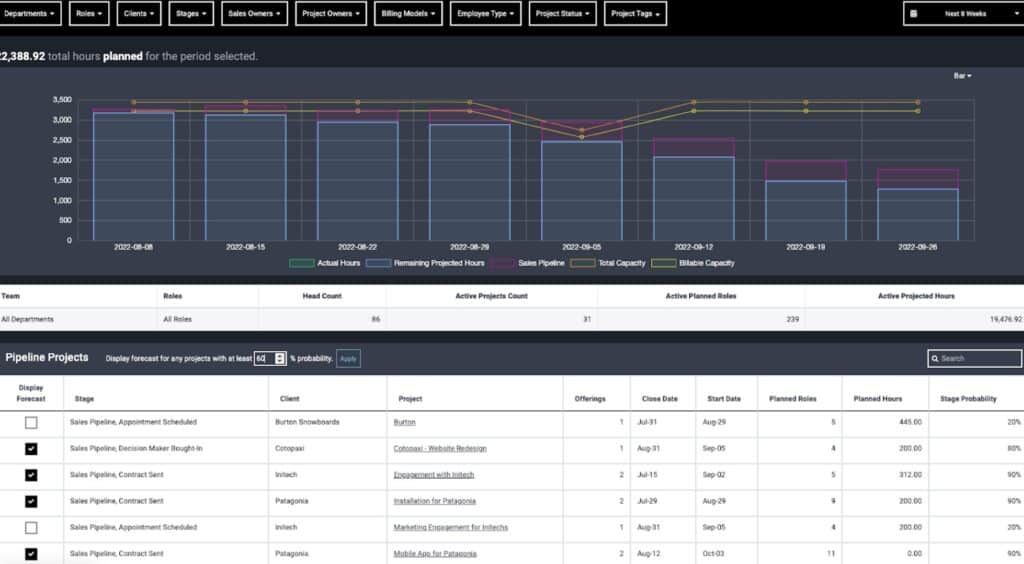
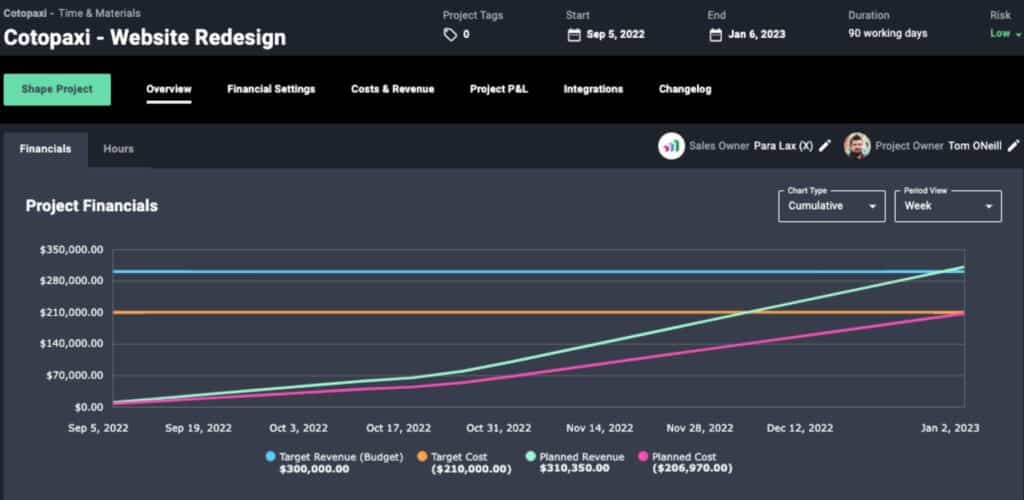
While Parallax supports various pricing and agency resource management methods, our solution works especially well with duration-based planning. Resource planning features allow teams to assign a percentage of each employee’s time to a project. This makes it easy to visualize resource allocation.
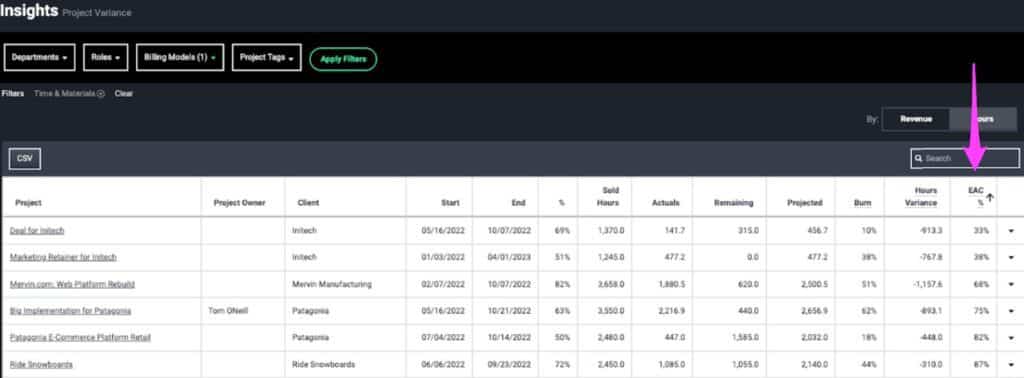
At the same time, project managers can continually watch for shifts in project variance by looking at projected start and end dates, the burn-down in tasks, and the estimated time to complete the projects. If things start to get off track, project managers and resource managers can act quickly and strategically, together.
Are you looking to scale with ease? Do you want to create an environment for your workforce that has less friction and more success? Parallax can help. Book a free demo today!