Digital services companies set themselves apart from each other with the caliber of their craft, method, and people. But when it comes to running the business and managing operations, we’re all more alike than different.
This should be good news because you don’t have to spend creative energy reinventing the wheel for resource planning, forecasting, or reporting. You can spend more time doing what you’re good at — your craft!
It also means there are benchmarks you can reference to see just how well you’re performing compared to other service companies. But calculating business performance metrics can be complicated and often takes a comfortable seat on the back burner because other priorities seem more pressing.
Luckily, we offer a simple Industry Benchmark Calculator to help you quickly visualize your performance and compare it to agency benchmarks.
This article will provide guidance on how to use the Industry Benchmark Calculator, a tool designed to help digital services companies evaluate their operational performance and compare it to industry benchmarks.
By following the outlined steps, you can quickly visualize performance and identify areas for improvement.
Key Takeaways:
- Tracking, calculating, and benchmarking performance is crucial for driving growth and overcoming operational challenges.
- The Industry Benchmark Calculator requires users to input operational, sales, and revenue data, as well as utilization and revenue capacity information.
- The calculator helps users identify key performance metrics such as sales bookings, planned backlog, write-offs, billable utilization, and employee revenue.
- Comparing your results to industry benchmarks can reveal areas where your business can improve to stay competitive.
- Implementing best practices and investing in tools like Parallax can help businesses grow and operate more efficiently.
Table of Contents
- What Are Industry Benchmarks?
- Why Tracking, Calculating & Benchmarking Performance Is Critical
- How to Calculate Benchmarks Using the Industry Benchmark Calculator
- Understanding the Industry Benchmark Calculator Results

What Are Industry Benchmarks?
Put simply, industry benchmarks are the metrics digital services companies use to measure their performance when compared to other companies in their industry. These benchmarks help you determine the overall health of your business and areas where you must improve.
Why Tracking, Calculating & Benchmarking Performance Is Critical
At Parallax, we believe services organizations like agencies and software development studios must prioritize gaining visibility into key organizational metrics. In fact, we think understanding operational performance and having an action plan for how to improve it is key to driving growth.
It’s what helps a business overcome the growth stuck point — allowing them to scale from heroic efforts and gut instincts to smooth and strategic operations.
To make it easier for you to track and calculate your business performance — and compare yourself against benchmarks — we created the Industry Benchmark Calculator.
Simply enter operational inputs, sales and revenue targets, utilization data, and revenue capacity data, and you’ll see how your performance compares to the following benchmarks:
- % of gross revenue targets in the sales bookings
- % of gross revenue targets Planned in the backlog
- Write-offs
- Billable utilization
- Employee revenue
- Revenue per billable employee
- Revenue per employee
How to Calculate Benchmarks Using the Industry Benchmark Calculator
Ready to get started? Access the industry benchmark calculator, create your own copy of it, and then follow our instructions below to calculate your performance. The outputs you get from the calculator are meant to be directionally correct, giving you a sense of how you stack up to benchmarks and where it’s best to focus your energy.
If you need help filling out the calculator or want to talk through how to dial in some of these numbers, shoot us a note at hello@getparallax.com — we’d love to help!
Step 1: Business Inputs
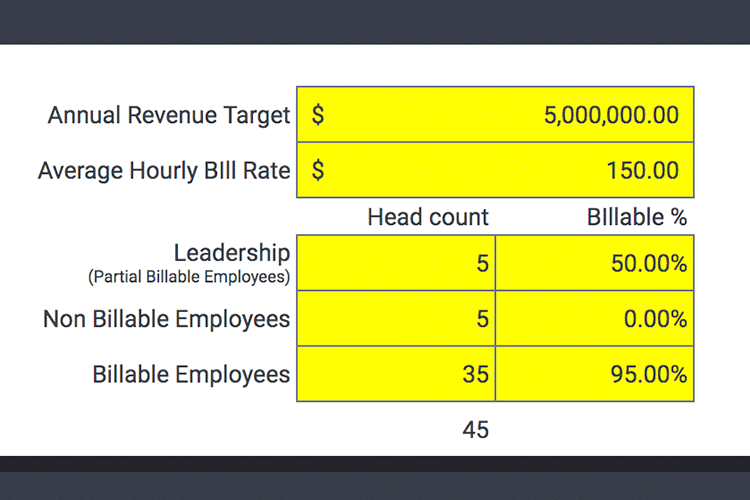
The purpose of this first step is to understand where your organization stands today with its annual revenue target and team makeup. These inputs impact the rest of the calculator, so it’s important to enter them as accurately as possible.
- Fill in your Annual Revenue Target and your Average Hourly Bill Rate. If you use a blended rate or average rate by role, you’ll need to do a little math to find your average rate.
- Enter how many of your employees are billable, partially billable (e.g., leadership), and non-billable.
- Next to each employee group’s headcount, enter the average percentage of time you expect each group to bill.
Step 2: Sales and Revenue Targets

This section helps you map your revenue targets by quarter to account for natural seasonal dips or upticks across the calendar year.
The calculator will estimate how much revenue should be identified in the sales pipeline, in sales bookings, and in the planned backlog to hit your revenue targets each quarter.
Proactively understanding these numbers will help you spot dips in the sales pipeline you may need to fill by stepping up your business development efforts or by investing more in marketing.
Gross Revenue Targets
Enter your revenue distribution by quarter, accounting for expected seasonal dips or upticks. The total should equal 100%.
The output — Quarterly Gross Revenue Targets (C21) — tells you how much revenue you need to earn each quarter to hit your Annual Revenue Target (G8).
Sales Pipeline Targets
The Sales Booking Target (C25) tells you how much you need to sell to hit your Quarterly Gross Revenue Targets (C21). You should aim for 110% of your Quarterly Gross Revenue Targets in sales bookings because, if you’re like most services companies, you’re likely to lose some of the booked revenue along the way.
Deal Pipeline Relative to Bookings Target (C27) is the first benchmark on the calculator. Benchmarks suggest that the sales pipeline should have 125 – 275% of what the Sales Booking Target (C25) is in qualified opportunities.
The calculator defaults to the benchmark midpoint of 182%, but you can use the dropdown to adjust this to the low (125%) or high (275%) benchmark to see how it impacts your pipeline targets.
Based on the Deal Pipeline Relative to Bookings Target benchmark (C27) you choose for each quarter, you get a Pipeline Value Target (C29). This number tells you how much revenue you should have in your sales pipeline each quarter to meet your Sales Bookings Targets (C25).
Finally, head to your CRM and see how much projected revenue your pipeline currently has for each quarter. Enter this into the calculator by quarter.
Based on what you enter for Actual Revenue Per Quarter in the Sales Pipeline (C31), the calculator will tell you how you’re performing against that benchmark (C32).
You should have at least 125% of your Sales Booking Target (C25) in your sales pipeline on the low end. A high-performing company should have 275% of its Sales Booking Target (C25) accounted for in its sales pipeline.
Planned Backlog Targets
Benchmarks suggest that you should have 23 – 61% of your Quarterly Gross Revenue Target (C21) in your planned backlog.
The calculator defaults to the benchmark midpoint of 50%, but you can use the dropdown to adjust this to the low (23%) or high (61%) benchmark to see how it impacts the amount of revenue you need in your planned backlog each quarter (C36).
Your Planned Backlog Revenue Target (C35) is how much revenue you have accounted for in the work you’ve already planned or started working on (i.e., your planned backlog).
Next, estimate how much planned revenue you currently have in your planned backlog. (If you’re a Parallax customer, you can access this directly from your dashboard). Enter this into the calculator by quarter.
Based on what you enter for Actual Planned Revenue in Backlog (C38), the calculator will tell you how you’re performing against that benchmark (C39). You should have at least 23% of your Quarterly Gross Revenue Target (C21) in your planned backlog on the low end.
A high-performing company would have 61% of its Quarterly Gross Revenue Target (C21) accounted for in its planned backlog.
Finally, choose your Average Write-Off Percentage (C41) from the dropdown menu. A write-off is the percentage of revenue that you lose in an average period.
Benchmarks suggest that agencies should write off no more than 4% at a low level, while high-performing companies should only write off 1%.
Once you select your Average Write-Off, it will calculate how much of your Gross Revenue Target (C21) you’re projected to lose each quarter.
Once you complete all of the inputs for this section, the calculator will give you your Net Revenue Target. This is how much you’re projected to net in revenue after write-offs.
Step 3: Utilization & Revenue Capacity
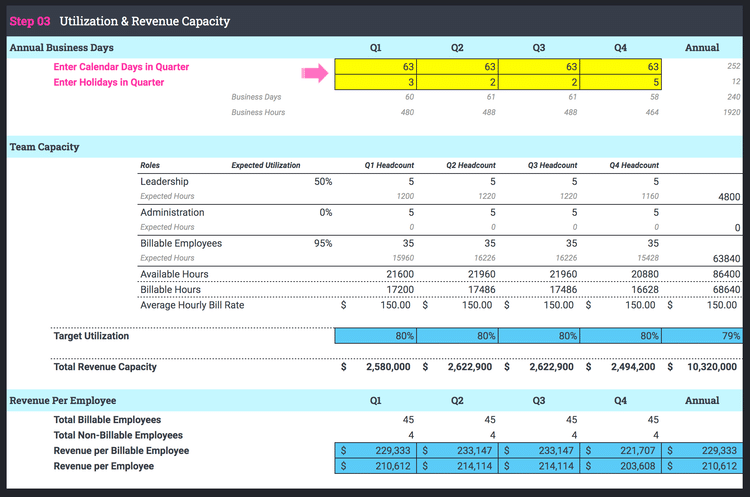
This section helps you evaluate whether you can actually earn the revenue you’re targeting based on your employee headcount, utilization, and revenue capacity.
If your Total Revenue Capacity is lower than your Annual Revenue Target, it’s a sign you may need to hire more people or implement strategies to increase utilization.
Annual Business Days
The first step to thinking about revenue capacity is knowing how many hours there are available to complete billable work. Calculate this by entering the number of calendar days in each quarter and the number of holidays per quarter.
The calculator will then tell you how many business days (E52) and business hours (E53) you have to work with each quarter and annually.
Team Capacity
The Team Capacity section is completed for you using the inputs you added in Step 1. Based on what you entered for each employee group’s expected utilization, headcount, and average bill rate, the calculator will tell you your Target Utilization (C67) and Total Revenue Capacity (C69).
Compare your Target Utilization (C67) to the Billable Utilization Benchmark in the sidebar to see how you’re performing. Benchmarks suggest that agencies should have at least a 60% utilization rate at a low point, and high-performing agencies should strive for an 85% utilization rate.
Compare your Total Revenue Capacity (C69) to your Annual Revenue Target (G8) and Quarterly Gross Revenue Targets (C21) to see if you have the people and utilization level necessary to hit your targets.
Revenue Per Employee
The Revenue Per Employee section is also completed for you using the inputs you added in Step 1 and your calculated Total Revenue Capacity (C69).
Compare your Revenue per Billable Employee and Revenue per Employee to the benchmarks in the sidebar. The difference between these two numbers is that Revenue per Employee accounts for all employees, including those who don’t bill to clients (e.g., admins and finance).
Revenue per Billable Employee only accounts for employees that bill clients for their time. Benchmarks suggest that at a low level, agencies should bill at least $104,000 per Billable Employee. High-performing agencies should bill $291,000 per Billable Employee.
The benchmark for Revenue per Employee ranges from $77,000 at a low point to $253,000 at a high end.
Understanding the Industry Benchmark Calculator Results
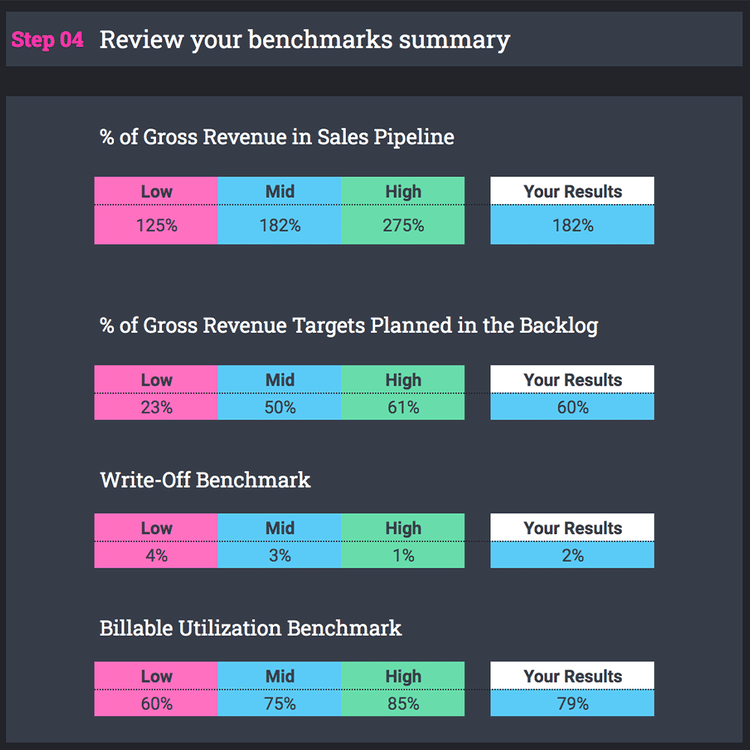
The final step of the benchmark calculator summarizes your operational performance results compared to the agency benchmarks. This helps paint a clearer picture of where your agency needs to improve its performance.
For example, you’ll see a clearer picture of your revenue per employee benchmark, billable utilization benchmark, and other key metrics. Let’s discuss the results you may receive and how to improve.
Percent of Gross Revenue Targets in the Sales Booking Benchmark
What it means: How much in sales bookings you need compared to your gross revenue targets.
How to improve: If you have too little in sales bookings, it’s a sign that you need to improve your business development efforts. Ask yourself:
- Does my sales team have the resources it needs to be successful?
- Am I investing enough in sales and marketing?
- Have we adopted sales operations best practices?
- How effectively does my sales team communicate with my delivery team?
- Does sales understand the unique value we provide, and can it communicate it well?
Percent of Gross Revenue Targets Planned in the Backlog Benchmark
What it means: How much in planned work (already sold and accounted for in revenue) you need compared to your gross revenue targets.
How to improve: If you have too little in your planned backlog, it’s a sign you need to improve how efficiently and effectively you close deals. Ideally, you would be able to schedule projects further out in the year as well. However, it’s pretty common for services companies not to have a ton of work in their planned backlog.
Write-off Benchmark
What it means: How much revenue you lose in an average period due to fixing mistakes, offering something to a client at no or low cost, or incorrectly estimating the amount of time necessary to complete something.
How to improve: Write-offs will happen; it’s a normal part of business. However, standardizing your services can help reduce write-offs because they allow you to better understand and plan work.
They’re projects you’ve done many times before, so you know what to expect, and you’re less frequently caught off guard.
Billable Utilization Benchmark
What it means: How much of your employees’ time, on average, is applied to billable work.
How to improve: Utilization is a lagging indicator, so by the time most agencies realize they’re falling short on it, it’s too late to improve it. When the team leads ask employees to focus on hitting billable hours over anything else, it can cause employees to become disengaged, dissatisfied, and resentful.
A better approach to improving utilization is to encourage and empower employees to focus on how best to deliver value.
It’s equally (if not more important) for leaders to ensure their teams have enough work opportunities to keep them busy so that they can deliver that value.
To track and measure utilization more proactively, implement the following utilization best practices:
- Update and review project-level resource plans each week.
- Better communicate the value of timesheets and adopt a weekly process that verifies all timesheets are complete.
- Regularly review planned utilization against utilization targets to identify dips in the sales pipeline that the agency needs to fill.
Employee Revenue Benchmark
What it means: How much revenue you make per employee (including per billable employee and per employee on average).
How to improve: Increasing the amount of revenue earned per employee often comes down to improving the efficiency of your employees’ work. One of the best ways to do this is to standardize 60-80% of your service offerings.
Innovative work will always be necessary to stay relevant, but repeatable, scalable work ultimately funds innovation, growth, and development.
Other revenue best practices include:
- Put resources against your sales pipeline opportunities so you proactively know if you have too few or too many staffed resources to deliver your projects.
- Improve the consistency of project pricing by encouraging collaboration between sales and delivery.
- Raise your rates. It’s easier to raise rates when you understand the value of your time, which you can calculate better using things like supply and demand forecasting.
Next Steps: Invest in Success With Parallax
If you completed the agency benchmark calculator, it’s a sign you’re ready to invest in your business’s growth and success. We built Parallax to help teams like yours scale the magic that makes them great.
We’re passionate about empowering services companies with information and creating a shared perspective across teams. With Parallax, you can focus more on what you’re great at and less on recreating new ways to run your business.
If you’d like to see how Parallax improves visibility into key organizational metrics and enables you to act more proactively and strategically, schedule a demo. We’ll walk you through how our product can give your team the information it needs to grow to its next level of greatness.