
We covered why utilization and project margin are the two most important KPIs that digital services organizations need to prioritize. Now, let’s dive a little deeper with specific tips on how to protect, and even improve, project margins.
Economic uncertainty is causing business leaders to become more conservative with their resources. A looming recession, layoffs across tech sectors, and shrinking budgets mean digital services companies need to optimize their performance and maximize their resources without burning people out. It’s imperative to ensure sales and delivery teams are aligned on what it takes to deliver work profitably and to democratize project financial data so that delivery teams can manage projects proactively to meet financial targets.
In today’s environment, managing to margin and making sure that teams are executing profitably is key.
First, identify the root cause of poor project margins
Knowing that your project margins are lacking is one thing, but in order to improve them, you need to be able to identify the root cause(s) of the issue. There are three usual suspects when it comes to poor project margins: sales oversight, resourcing misalignment, and irresponsible project execution.
Sales oversight: All too often, digital services companies become hyper-focused on sales and revenue growth, causing them to lose track of what it takes to deliver projects profitably. When this tunnel vision sets in, organizations tend to drive down their bill rate in an effort to win as much work as possible – and project margins will inevitably sink.
Is your organization prioritizing revenue growth over delivery quality and profit margins? Are you lacking visibility into what your forecasted margins will be for proposed projects? If so, sales oversight is likely the root cause of your poor project margins.
Resourcing misalignment: We all know that the availability and capacity of team members can change in the blink of an eye in the digital services world. Let’s say a new project was priced based on a team you thought would be available, but when you get to the point of staffing the project, none of the junior staffers originally slated for the work have available capacity to take on the project. Your options are to leverage more senior staff with higher bill rates or leverage a contractor pool, which is almost always going to cost more than the junior staffers you originally had in mind.
Without adequate resource planning or visibility into current and projected availability of lower-cost resources, the costs will creep higher, and your project margins will take a hit. Sound familiar?
Unrealistic project expectations: The first two scenarios showcase how project margins can be lower than targets without anything to do with project execution. Yet, almost always, poor project margins are blamed on the project management team. Even if the project was set up for failure, due to resource swapping and sales misalignment, it’s often the assumption that overages are a result of the project manager not running projects efficiently. My father taught me at a young age that golf wagers are won and lost on the first tee, where golfers negotiate strokes based on handicaps. The same can be said about negotiating your scope, budget, and bill rates before kicking off a project.
When projects are set up for success from a planning perspective, then the root cause of the issues may in fact lie with the delivery team. When the project team doesn’t have the appropriate tools to proactively monitor and manage project financials, project managers by default take on a “do what we need to do to get the project done” approach. It becomes more about trying to keep the customer happy and getting the project completed and less about paying attention to the economics of the project. The team burns out in the process and at the end of the project, the organization ends up losing money.
Are you running into extensive project overages, regularly overworking the team, and exhausting all other resources for projects that were planned responsibly (i.e. responsible sales and resourcing)? Unrealistic project expectations are likely your root cause for poor project margins.
How to mitigate project margin challenges and improve operations
After the root cause(s) impacting project margins have been identified, it’s then time to implement best practices across the organization to course correct. Here are a few tried-and-true practices that we’ve seen work well for digital services organizations to not only mitigate margin challenges but also to mature their operations.
Build more rigor into the sales and resource planning process: Data from CRM platforms, or resource and staffing plans, often exists in silos. A consequence of this locked-up data is that sales teams seldom have visibility into the project backlog which impacts when and how the work they’re selling can be delivered. Delivery teams, on the other hand, lack visibility into the sales pipeline and struggle to balance workloads and make data-driven staffing decisions.
A more mature approach includes regular touchpoints between sales and delivery leads to look at sales pipeline data – so both have a clear sense of what’s in the pipeline and resource availability for upcoming work.
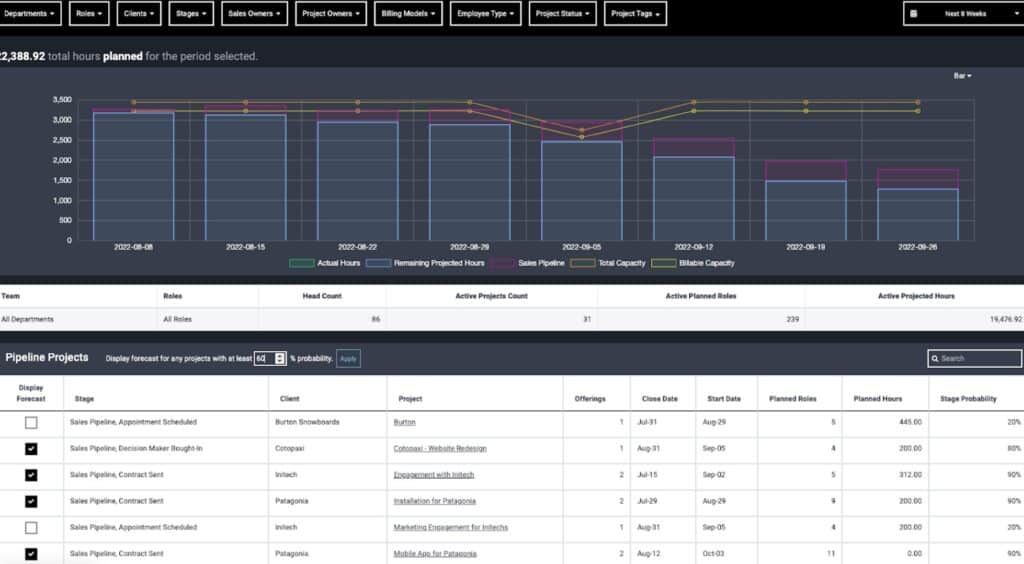
In order for the sales pipeline and resource forecasting process to be achievable, sales needs a simple way to attach high level resource plans to the deals they are pricing so everyone has a sense of what it’ll take to deliver work and meet margin goals.
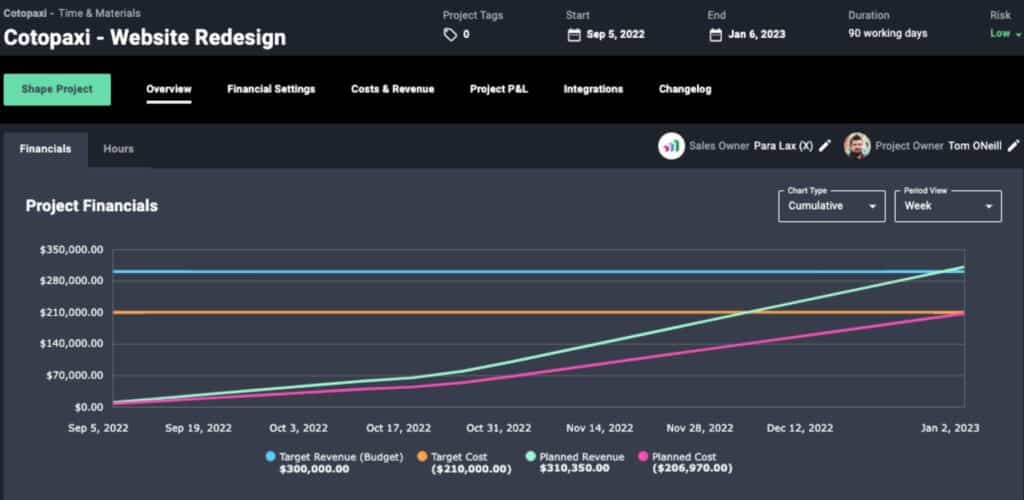
Parallax delivers more confidence, accuracy, and alignment for sales and delivery teams. By integrating with leading CRMs, sales leaders can leverage service offering templates as a firm starting point when pricing and planning new deals. And delivery and operations teams have a clear understanding of what’s being sold and can work proactively to earmark or assign the right resources – at the right bill rates – to execute the work, manage expectations, and meet margin goals. Parallax helps answer questions like: Who has the capacity to take on new work and who doesn’t? Which teams are already heavily utilized and which aren’t? Do we have the right mix of resources if we close the majority of our pipeline?

Put project financials front and center: If your projects are planned with the right economics – with the right resources and for the right amount of time – then any challenges with project margins are likely going to be stemming from project delivery itself. If that’s the case, here are a few course-correcting steps to consider:
- Democratize project financials: Automate reporting around project burn against budget so the team has real-time visibility into the burn of in-progress projects. Better yet, leverage resource planning and project actuals together to forecast planned burn against budget in the future. With real-time reporting and forecasting for project financials, there should be no surprises when it comes to finalizing project financials for projects. Let’s say a project was scoped for $90K over three months, but after one month, the team has burned through more than half the budget. If this pace was unexpected, the lead or project manager then has the opportunity to reset and scale back with the team to better align with remaining budget OR proactively communicate with the customer to request a change order or an increase in budget.
- Incentivize fiscally responsible sales and project management: Sales teams and project managers have the greatest influence over whether or not projects are executed profitably. Create accountability in your organization for team members selling and managing projects.
- Dig deeper into delivery challenges: If overages continue, dive a little deeper and investigate where additional challenges may be lurking:
- Is it a certain offering where margins are low (website development, SEO offering, etc.)?
- Is a certain role within the team burning more hours than expected (engineering, UX designers, marketing strategists, etc.)?
- Are there certain team members who are consistently actualizing more hours than planned?
- Are there variances in project margins with the different billing models (fixed fee vs retainer vs time & materials)?
Connect with Parallax
What’s key to overcoming any of the challenges we laid out above is having a technical architecture that can provide greater visibility into the key metrics to the business so that the team is enabled to make data-driven decisions about the business. By using data and insights to understand where the problems are stemming from, you can then start to proactively address the inefficiencies and get margins back on track before they take a larger toll on company performance. This is how digital services companies mature their operations to effectively meet margin targets.
Even more, being able to calculate and forecast these metrics is a foundational capability for digital services organizations. If you’re not able to baseline where your organization is performing in each of these areas today – or forecast where you expect to land in the coming months – that’s absolutely OK. And that’s why we’re here! Parallax is built to help you gain an understanding of where you are today so you can develop a game plan to get to where you want to be.
Connect with us today to learn how some simple steps and connections across sales and delivery practices can help protect project margins – no matter the economic conditions.