“The Shape of Things to Come” is a work of science fiction by H.G. Wells and for some digital services firms, accurate forecasts of future resource needs feel like a work of science fiction as well.
At Parallax, we view resource requirements for individual projects as having a shape. Think of a line graph that plots the resources needed over time. Early in the project, design resource usage is high and then decreases a bit as development resources ramp up. While spreadsheets can do a decent job of tracking individual resources, current assignments and future availability relative to booked projects, adding forecasted sales into the mix is the alien in the room: something scary and unknown.
The most successful digital services firms put effort into adding more fidelity to the pipeline earlier in the sales process rather than later. However, for most organizations, resource forecasting relative to deals in the pipeline is based on a weighted revenue forecast coming from their CRM, not a resource plan. Fidelity requires including potential resource plans, i.e. resources over time with specific allocations. It also takes time and effort which is sometimes viewed as not justifiable early in the sales cycle when the probability of closing the deal is still low.
With Parallax, sales people can easily forecast projects in your CRM based on predefined service offerings that include an additional level of detail – the types, amounts, and timing of resources required to complete a specific type of project. These templates, or project shapes as we call them, represent the most common service offerings and are informed historical projects. Using templates to forecast projects results in more consistent and accurate project estimations.
These details not only result in more accurate resource forecasts, they give salespeople the information they need to have meaningful project scoping conversations with prospects earlier than the competition. Based on these conversations, the salespeople can consult with technical resources and solutions architects to adjust the “shape” of the projects when they’re in the pipeline which allows for more accurate forecasting and proactive resource allocation when the deal closes. This detail also provides much better insight into the impact of each opportunity, not just from a revenue perspective, but from a profitability perspective as well.
Once a project is in flight, the actual resources used rarely reflect the resource plan developed at the beginning of the project. The shape of the project shifts and changes as the work progresses. Some types of resources may have been underestimated, others overestimated. In an agile environment, the project scope may change as the details are better understood. Parallax allows resource and project managers to dynamically adjust the shape of active projects, giving greater visibility into resources that may be freed up earlier for other projects or additional resources that may be needed later on to complete the work.
At the end of the day, digital service organizations need the answer to two key questions. Do we have the backlog of work and team required to hit our revenue targets? And how confident are we that our current revenue projections are accurate?
To answer these questions requires layering the shapes of active projects to build an aggregated resource plan and then going beyond that to layer on the shapes of forecasted projects to understand resource requirements going forward, no easy task without a solution like Parallax. Also, updating and refining the shapes of active and forecasted projects is a dynamic process. Successful organizations typically refine higher probability deals (>50%) in the pipeline on a weekly basis as conversations progress with clients and as close dates become imminent.
Resource and revenue forecasting are not alien concepts to Parallax, it’s one of the purposes for which it was built. It helps organizations evolve resource planning from a function to resource forecasting as a way to successfully manage and grow the business.
Success requires continuous improvement. This is especially true in the solutions architecture and sales leadership roles I’ve held and led in the custom software development industry.
In these roles, I’ve evolved an approach and point of view on how to tackle a range of challenges. Some ideas I’ve kept, refined, and instilled in others. But a few tactics have dropped off along the way. One of them is the detailed, task-based proposal. Read on to find out why.
What are they?
Love ‘em or hate ‘em: task-based proposals often mimic a statement of work, including aspirational descriptions of each major feature to be built, verbose details of each task the team will perform (often chronologically), carefully-worded limits and constraints to manage budgets and timelines, and, the king-pin of this approach, a long table or list enumerating all of these features and tasks with each associated hourly or cost estimate. The proposed cost of the project is simply and clearly calculated from the sum total of this list.
Task-based proposals are deemed necessary and successful for a few reasons – the descriptive content speaks directly to the perceived needs of the customer; the 1:1 correlation of task to line-item justifies the proposed budget; the volumes of technical and procedural language can deflect objections to technical credibility and expertise. To be fair, for smaller shops where delivery practitioners also do sales discovery and write their own proposals, this style of proposal can be effective! But let’s acknowledge why – there isn’t a hand-off event that triggers re-evaluation of the proposed work.
There are drawbacks, too. Selling on tactical deliverables will seldom set you apart from the competition and will incentivize price shopping. It’s a slippery slope to commoditization from there. Prospective clients will compare apples-to-apples and make a la carte selections. They will get caught up in technical debates on specific, minute details of a proposal. Specific tasks will get cut to win the deal, creating a rift between sales and delivery as the latter realizes their time is being undercut or undervalued. Or, to hedge against risk of the unknown, every estimate is inflated – first by sales and again by delivery, meaning your ability to execute a client’s goal within their budget will be sabotaged by artificially padded budgets.
As sales practices grow, the precision required in detailed proposals is all but impossible to achieve. You either need to slow down the pre-sale process and do more free discovery with tactical practitioners to validate the work, put too many caveats in the proposal, or continue to mitigate risk by padding budgets. Even with padding and caveats, each hand-off event is going to resurface skepticism, triggering (re)evaluation and, you guessed it, more line-item padding and more caveats.
Why should we abandon detailed proposals?
I believe the root issue is that humans are just pretty bad at estimating time, and that delegation at hand-off rarely goes well with this pricing method. Pitching work (let alone executing it) under a task-based proposal does little to fortify your consultancy’s unique value or promote creative, innovative problem-solving. If teams are so boxed in to spend only small amounts of time on predetermined tasks and deliverables, they’re encouraged to prioritize time over quality. Unaccounted time for context switching and draconian project management will invariably kill budgets and margin. Plus, a delegation based on tasks – not of the ultimate outcome – can lead to major changes in scope after hand-off once technical practitioners dig in to solve a problem.
Here’s one (slightly fictionalized) such example; one of several similar anecdotes I’ve witnessed:
Limited discovery and poor hand-offs, at scale, leads to re-evaluation of EVERY task
Charles*, the CEO at Some Fictitious Agency* (*names have been changed to protect the guilty) has grown his firm aggressively and has a sales team dedicated to growing new business. The sales reps are ambitious, and they each rely on their favorite members of the delivery team to help review and estimate work. They’re cranking a dozen or more detailed proposals each month now; more than Charles can keep track of!
Charles gets an email. It’s from a new client, one he hasn’t met yet. This client is livid.
“What kind of bait and switch is this? Your sales team told me everything I wanted to hear, and I even signed a proposal that’s higher than my budget because of how good you say you are. We’re barely 2 weeks into my project, I’ve already paid 50% down, and you’re telling me it’s gonna cost 50% more than planned?? I want my money back.”
What the heck happened? Charles pulls together an 8am meeting with the rest of the team to review.
As expected, the sales rep had consulted with a qualified designer and a strong lead dev in the sales process. They spent a week crafting a 6 page proposal, including a line item list over a page long with everything they expected the project team to do. The client saw this, was impressed, and signed off on the project.
The project kickoff was scheduled, a team was resourced, a PM was assigned, and the sales rep handed off the project to the new team. The original estimation team was there, too. Seems fine, right? Well, kinda. The sales rep spent the kickoff meeting hyping up the project to the new team, and the lead dev who estimated it spent time justifying his estimates and validating his project plan. The new team tried to absorb it all, but at the end of the day, all they had was the page of line items from the proposal and a high-level understanding of the project.
As the PM worked with the team to write tickets and build the backlog, they re-estimated each task. The new team, in order to assuage their uncertainty, added a few hours to each task so they could figure things out as they went. With over 50 line items on the proposal, that small padding on each one added up – fast! Detailed proposals and task-based project plans like these commonly fail because they encourage micromanagement through a dictated list of small jobs and don’t focus on the final outcome desired for customers. At scale, it’s increasingly difficult to build a detailed plan in the limited time available during a sales conversation. Teams compensate by inflating budgets to offset the risk of the unknown. Each time the project plan is re-evaluated or handed off, this risk mitigation strategy is re-played and budgets swell leading to difficult situations when scopes suddenly change.
Define and protect your unique value with a different approach to pricing
At Parallax, we’re big fans of value-based pricing. This method moves away from selling tactical deliverables (which does little to set you apart from other shops) and focuses more on the unique value[1] and problem-solving approach. Hand-in-hand with this philosophy is scoping work based on duration, not tasks. This method allocates portions of your team’s time to particular projects and doesn’t force anyone to specifically track each task. The final outcome and value you’re delivering to clients is what’s important. With this philosophy, the sales team knows the delivery team is working hard to solve clients’ problems. Delivery knows that sales is working to position them to deliver the most impactful work. Teams communicate, culture improves, and the business secures more good work. With duration-based proposals, pricing is more accurate, hand-offs are more pleasant, utilization improves, and delivery is focused on the value and the final outcome for customers, not individual tasks.
While Parallax supports multiple pricing and resource management methods, our tool works especially well with this method and enables duration-based resource management. It’s easy to assign a percentage of time to each employee’s time and visualize or forecast allocation across teams, projects, and departments. We can help you standardize your offerings with our “shapes” tool to quickly spin up projects based on common patterns from your most repeatable services.
Ready to learn more?
We’d love to talk to you about putting task-based pricing behind you to help your team do their best work. In the end, the more mature your consultancy becomes, the less task-oriented it should also operate. Duration-based pricing is a more efficient model that empowers employees and keeps everyone focused and on track, with clients seeing the true value of your partnership and team. That’s a win-win in my opinion.
While it’s critical for leaders of digital services to focus on business growth, they must also address the fundamental needs of their employees. This is the only proven method for improving employee engagement.
In this guide, we explain how leaders can do it all by harnessing the power of Maslow’s hierarchy of needs. We cover the five categories of Maslow’s model, including physiological needs, safety, love and belonging, esteem, and self-actualization.
We also discuss how each of these categories can be applied to create a strong culture, drive team engagement, and recognize employee performance.
Here are five key takeaways from the article:
To motivate your team to reach their full potential, it’s crucial to focus on the needs of your business and the fundamental needs of your people.
Maslow’s hierarchy of needs outlines five categories of human needs, from physiological needs to self-actualization, with higher needs emerging only when the more basic needs are met.
At the foundation, make sure the basics are covered, which include providing fair compensation, setting clear goals and expectations, and ensuring job security.
To create a strong culture, it’s important to help people feel connected to your company’s purpose and mission and establish ways for people and teams to feel connected.
Finally, driving esteem and meeting the need for recognition, respect, and freedom, as well as creating opportunities for people to realize their full potential, can help individuals become their best selves.
Digital services firms, much like the people who run them, are on a continual journey. We want our companies and our teams to be the best versions of themselves and to grow and evolve.
We want to motivate our people to reach their full potential and for our teams to achieve results. Getting there certainly requires a focus on the needs of the business, but also the fundamental needs of our people. One can’t grow without the other. But finding a balance between these two is easier said than done.
As many leaders navigate aggressive business growth, there’s also a perceived tension that culture and people-building will suffer as growth is emphasized. Small and tight-knit teams may feel that prioritizing business growth and meeting performance goals comes at the expense of the cultures they helped create.
Individual contributors may also lose sight of their own value and opportunities for development as the companies they joined early on begin to grow. Previously engaged employees may no longer feel a strong connection as companies evolve—or as they change themselves.
It’s well documented that strong and engaged teams drive business performance, so it’s important to understand what our people need. This is critical to improving employee engagement, especially given the unprecedented change and growth in the digital services industry.
There are a lot of leadership frameworks and models out there, but my favorite is one of the classics: Maslow’s hierarchy of needs.
What Is Maslow’s Hierarchy of Needs?
Maslow’s hierarchy of needs is a foundational concept of Parallax’s culture and vision, as well as how I shape and continue to evolve my approach to leadership, motivation, and team building.
Human needs can be broken down into five categories, from physiological needs to self-actualization, and the higher needs emerge only when the more basic needs are met.
Let’s be clear: Maslow’s model of how people achieve self-actualization to be their best selves is about a lot more than who those people are professionally! But I think the idea is effective at helping people become their best work selves and to realize their professional potential and career ambitions.
After all, we spend a lot of our lives at work, and we yearn for both professional and personal fulfillment. Heck, it’s called “earning a living” for a reason. Our professional lives should mean something!
Plus, I believe Maslow’s model is an effective way to think about leading, motivating, and evolving both businesses and the people who run them. Let’s break it down.
Improving Employee Engagement: Start With the Basics
The foundational layer of Maslow’s model is about survival. People need shelter, food, and transportation for themselves and their families. And to acquire those things, they need a fair wage for their work!
If people are secure in their finances, they can focus on everything else. On the other hand, if they’re distracted or worried about bills, they’re less effective. So it’s important to pay people fairly and to make sure the “contract” between employee and employer is fair and understood.
This means being clear on salaries, how they’re set, and how people can earn more as they grow.
The next layer, safety, is about helping employees feel secure in their jobs. That means setting clear goals and expectations. Another baseline distraction you should help your people avoid is the fear of being “blindsided” and fired one day out of the blue due to performance issues they weren’t aware of.
Make sure individuals know what’s expected of them and if they are meeting those expectations early and often.
These two baseline needs are often either misunderstood, miscommunicated, or not communicated at all by all leaders. But in Maslow’s model, it’s critical to get these right first to get to the fun part of helping people excel and thrive.
Creating Belonging and Connection
In the middle of Maslow’s hierarchy is the need for belonging and connection. To me, this is about creating and nurturing a strong culture and making sure people align with the values of an organization.
Make sure the values and purpose of your company are both known and reinforced. And establish ways for people and teams to feel connected to your purpose and mission.
At the end of the day, culture and belonging are important to the human AND the business. Engaged employees will feel fulfilled, respected, and nurtured–and businesses will excel with engaged and committed teams.
Rewarding and Recognizing
The next layer is about driving esteem and meeting the need for recognition, respect, and freedom. In a professional sense, I believe this is about recognizing and rewarding people for their performance while also helping them create real impact.
During times of growth or evolution, impact is about helping people shape the future of their careers and the organization. As people move up the ladder of needs, they’ll seek not only recognition but also influence.
Lead and motivate teams so they understand their impact on the organization today and how they can influence the future of the firm.
Self-Actualization: Reaching Your Full Potential
The top of Maslow’s pyramid refers to the need to be your best self and the reaching of your full potential. It may elicit eye rolls as academic bullsh*t jargon, but I truly believe that meeting people’s needs, from the most fundamental to the need for recognition, can bring out their absolute best.
The peak of Maslow’s model is about helping people realize their talents, contributions, or potential, both personally and professionally. Great leaders nurture and guide people to be their best selves and help them follow their passions.
But they also know that for people to reach this point of fulfillment, their other needs must be met, including the most fundamental ones.
Maslow’s Hierarchy of Needs Applied to Employee Engagement
The digital services field is full of growth, evolution, challenges, and change. An unintended consequence of this dynamic environment is that achieving business success can often come at the expense of focusing on personal growth and culture building for teams—or so it would seem.
Organizations need to be both smart and healthy to be truly successful. Smart means understanding the economics of the business: market dynamics, trends, financial performance, the competitive landscape, and more. Healthy means building a cohesive team characterized by trust, interdependence, solid relationships, and a strong culture.
Maslow’s model shows that addressing the fundamental and aspirational needs of people will create healthy, committed, and high-impact teams. Those strong teams whose needs are met, in turn, will drive business growth and help your organization reach its highest potential.
Learn How to Improve Employee Engagement With Parallax
If improving employee engagement is a priority for you but you’re not sure how to get started, we recommend starting with an assessment to gather meaningful feedback from employees and to get a pulse on where your firm is currently at.
Ah, the plight of our fellow project accountants. They have an (almost always) thankless job, but also one that’s critical to any digital consultancy’s health and performance.
These folks are responsible for going deep on data. They assess profit margins, compare trends across teams and services, forecast costs and revenue, and work to keep teams on track and budgets balanced. And they continually collect and send this detailed reporting to management, finance, delivery, sales…the list goes on.
Ever data-driven and analytical, they’re responsible for collecting and reporting across a number of KPIs to keep track of business performance and forecasting. Then, they’re at the center of conversations that are more existential in nature, too, sparking questions like: Are we selling correctly? Are we resourced appropriately? Are we delivering on plan and on budget?
The project accounting point of view is not only critical in answering these questions, but in providing data to inform decisions. And I’m here to tell you it’s HARD work!
Stuck in the status quo
The vast majority of these pros are managing all of this tracking and analysis with manual, cumbersome spreadsheets that are not only prone to human error, but are time consuming to produce. Once this static data is finally captured, populated, and reviewed, it’s probably out of date by the time it’s even reported. (Read more on why spreadsheets are a bummer).
What’s more, this time consuming and manual data entry forces these experts to work reactively and in the past, and it inhibits them from proactive forecasting and assessing business performance for the future. In other words, a lack of visibility into performance for tomorrow creates a lack of action today in this manual world. The struggle is real!
No one wants to live in the past and work in a reactive-only mode. But it’s this manual approach to financial tracking that keeps us stuck in an outmoded method. Being bogged down looking at actuals prevents project accountants from providing actionable guidance to heed off issues early. It reduces an ability to provide smarter and more accurate forecasts that can inform business decisions and assess overall project health. It limits insight.
Let’s be honest: Managing a digital services consultancy is operationally very challenging, labor intensive, and time consuming. This status quo approach is preventing project accountants from working smarter and more strategically. But there’s a better way.
Drive proactive, real-time reporting with Parallax
The beauty of Parallax is its ability to easily integrate the tools and platforms you’re already using to provide better visibility into project finance and overall business performance. Through a project accounting and finance lens, this solves two issues:
First is the labor-intensive tracking and reporting needed to assess project and team health. All the complex spreadsheets, time-consuming data entry, hours of validation and reporting? They’re a thing of the past! Info is available real time and it’s accurate. It doesn’t rely on manual data entry either. Parallax inputs real data from the real tools your teams are using for more instant visibility into project costs and revenues – with the ability to work across a number of billing models including variable rate cards, time and materials, fixed bid, or retainers.
Parallax also empowers project accountants to work more proactively and strategically. It enables better business analysis to help companies run more efficiently by integrating data from CRM, time management, and delivery platforms. With instant, reliable, and accurate access to project P&L and financial charts, project accountants can help adjust resources or re-align project goals and expectations – before it’s too late and there are concessions or change orders on the way.
Want to learn more?
Whether it’s your sales, delivery, operational, or accounting staff, we believe that Parallax can unlock the potential of your people. Giving them the right tools to succeed allows them to spend more time doing higher-value and more gratifying work.
With a more proactive approach through reporting and project forecasting, digital services shops can run healthier and happier. Project accountants can easily understand and report on business performance across projects and teams, and they can move away from frustrating, time consuming, and reactive reporting struggles. They get the visibility needed to overcome this reactive-only reporting and free up the time for better and smarter business forecasting.
Hey, project accountants! Go deeper on Parallax and tune in to a live demo on delivering more actionable, proactive reports.
When you first started your digital services company, you likely began building spreadsheets to collect data in a way that represents how you think.
These homegrown tools are a great place to start as you are getting your business off the ground because at this point, you’re small (and smart!) enough to be able to wing it and count on your team’s gut instinct to make early calls.
You’re probably reading this post right now because you realize that as you’ve continued to grow, your homegrown tools are starting to become too clunky, cumbersome, and complex to manage. This can be due to a host of reasons (more on that, below), and ultimately result in your team becoming reliant on a network of spreadsheets that require you to continuously piece together (and fix!) disparate data sources to meet your growing needs for sales forecasting, capacity planning, and revenue forecasting.
Not only does this homegrown spreadsheet solution eat into the time your limited resources could be spending on your craft (the billable work you love to do), it also becomes a burden and adds risk to the growth and evolution of your business.
Here are 5 key reasons your spreadsheets are holding you back from growing and evolving your digital services company, and what you can do about it.
1. They require manual effort to maintain
Everyone can agree that spreadsheets are hard to maintain, requiring a lot of manual effort. Even though correctly inputting data into different sheets is a time-consuming, error-prone process, it can still produce valuable insights, especially when the business is smaller, less complicated and doesn’t require a lot of data to work with.
The challenge comes as you continue to take on new and exciting work. The manual effort required to maintain your homegrown system of spreadsheets will start taking up a lot more of your time than it used to. More time from your team members needing to constantly check for data accuracy, ensure macros and formulas are correct, fix broken links, search for and piece together disparate data from multiple disconnected systems – all of which eats into the time they could be spending on billable client work.
All of this manual effort leads to the potential for human error, potentially eroding the confidence you once had in the insights this web of spreadsheets produce.
2. They don’t allow for timely forecasting
As your business continues to grow, the ability to forecast becomes much more impactful on your operations. Accurately forecasting projects and revenues help your organization make the right hiring decisions, price projects correctly, and manage resources effectively. Growing digital services companies often continue to rely on interconnected spreadsheets to create forecasts, because this is what they know and what they built their operations on. At this stage, the way to generate these forecasts involves inputting data across multiple spreadsheets mentioned above over the course of a few days or even weeks. And by the time you’ve produced one forecast, the rest of your team has already moved on to the next ask. This reactive cycle can be tough to break when you’re relying on a homegrown forecasting system.
It might not feel like it right now, but this is a good problem to have! You’re hitting a point in your growth where you recognize that you need data visibility and insights to better plan ahead and make smart investments, but also realize that your current process for generating forecasts is too slow to be meaningful.
3. They are difficult to integrate
Getting your ever-expanding network of spreadsheets to work with the rest of your growing technology stack is a massive headache, and oftentimes not even possible as your business continues to grow. One incorrect formula or piece of data can affect projects or forecasts and have negative consequences on your bottom line.
That’s because your spreadsheets are not built to be integrated easily into other systems!
Your beloved spreadsheets have served you well up until this point, but you now have too many inputs and variables to consider that affect the outcome and profitability of a growing number of projects. Continuing to rely on a system where both the data and formulas can be wrong is a risk you can no longer afford to take. What you really need are data-informed insights in order to make smart strategic, hiring, and operations decisions that come from an integrated data system.
4. They require a massive learning curve
Learning how to update, operate, and get answers from a unique system of spreadsheets you custom-built is a difficult task for even the most experienced spreadsheet users. Remember how you built this system based on the way you think? Your new hires might think in a different way, and want to update the system you built to do things a bit differently.
It also takes additional time to train them how to correctly use the unique system you created, which is once again time they could be spending on the billable work you brought them on to do. The additional learning curve to get onboarded to a unique system could have an early negative impact on their morale and productivity.
Additionally, this can impact your ability to hire top talent. In this hiring market, potential candidates have more power in choosing their employer, often basing these decisions on the tools they’ll have access to. Although you may understand and appreciate the intricacies of your spreadsheets, new hires want to work for companies that understand what good looks like and supply their people with the best-in-class tool kits.
5. They inhibit problem solving
Your project managers are responsible for a lot! They are often evaluated on their ability to keep projects on time and on budget while keeping the team happy, and are most often tasked with solving problems on any given project or client as quickly as they arise, which any seasoned PM knows can happen on a daily basis. This is no easy task.
Let’s say you’ve hit a delay on the mobile app project you currently have underway, and your client is asking for a timing and budget status report to understand why and how to get things back on track. When you’re using a manual system of spreadsheets, your PMs end up in reactive-mode, spending hours or even days gathering inputs from other employees on how much time they’ve spent on said mobile app project, what’s been billed to date, what delays to account for, and manually entering them into several disconnected spreadsheets.
In addition to the time spent gathering initial data, your PMs are then burdened with developing actionable insights needed to explain why this project is delayed, and what it’s going to take to get things back on track. As you continue to grow, this haphazard process is now too slow to be actionable and creates a lot of unnecessary bottlenecks, where the time spent gathering and analyzing data could have actually been spent working directly with the team to solve the problem at-hand. What they really need are systems that stay up to date in real-time through integrations vs. manual upkeep of spreadsheets.
Parallax helps reduce your reliance on homegrown spreadsheet systems
Thankfully, there are professional services automation platforms that can help reduce your reliance on unique and homegrown spreadsheet systems as you continue to grow and evolve. Using a tool like Parallax can also make it easier to adopt agency best practices related to sales and operations, which means you can focus more on what actually makes you unique: your craft.
By integrating with the tools you already use, Parallax gives you real-time visibility into accurate data and business insights, and allows the parts of your existing system to speak to each other – from pricing estimation all the way to project completion. You can also run reports that answer your most pressing questions, and you can use these insights to more confidently forecast sales opportunities, conduct capacity planning and forecast revenue.
Additionally, Parallax’s integration-first approach allows you to keep the tools you already use and love with thoughtful and strategic integrations that fill the gaps that digital services firms often face with their cross-functional systems. All of which result in less headaches for project managers, as they no longer have to cobble together homegrown spreadsheet solutions!
Specifically built for the needs of digital services companies, professional services automation (PSA) platforms help digital agencies manage time tracking, contracts, project management, invoicing, billing, and more. Most importantly, PSA platforms help you accurately predict sales and manage resources around your projects.
You might also be considering ERP and project management software options, although it’s important to keep in mind that while they offer similar features, these are built mostly for product companies and could add unnecessary complexity, cost and frustration for services companies. To learn more about why you should be using a PSA platform and not an ERP or project management software solution, check out this post.
Selecting and adopting a PSA platform can have a tremendous impact on the long-term growth and success of your business, so it’s important to make sure you take the time to carefully evaluate your options. Every digital services company has different needs, which means there isn’t a singular perfect method for evaluating the options available to you; however, there are a few key questions we recommend considering during the evaluation process once you have a list of platforms to consider.
How well does this platform work with my existing tools?
You are likely already using a host of tools to facilitate various processes in your organization, so it’s worthwhile to consider platforms that will allow you to build on what’s already working for you. Adopting a new platform that requires your team to learn several new tools and processes can easily overwhelm them, or require additional workarounds just to use the tools they are currently using.
Instead of replacing all of those tools with an entirely new system, consider the ways in which the platform can integrate with your existing tools, and allow you to unlock more value from all of them by asking the following questions:
What integrations currently exist with this platform?
What tools are we using today that we don’t need or want to replace?
Does this solution work with the tools we use currently, or is it built to replace the tools I already have?
If replacing existing tools, will this solution be an improvement or simply a lateral move?
How often are new integrations being added, and how often are they updated?’
What does the onboarding process look like?
Understanding the effort and requirements related to the onboarding experience is another important consideration when it comes to evaluating PSA solutions. Adopting a PSA platform is no small feat regardless of the tool you select, but a long, inefficient onboarding process could overwhelm your team and prevent you from taking advantage of your newly purchased PSA platform. Some questions you should consider relating to onboarding are:
How long is the onboarding process for organizations like you?
Who will need to be involved and what are the responsibilities and expectations I need to prepare for and set with my team?
Is there a significant learning curve?
What makes onboarding go smoothly, and where are the typical risks or roadblocks?
How quickly can I start using the platform and begin seeing value?
How supportive is the PSA provider?
You will likely look for continued support from the PSA provider after onboarding and implementation in order to fully take advantage of the platform. In our experience, the type of support and partnership provided here can make or break your overall PSA experience. As you think about the users of this tool within your organization, consider the level of support you are offered by asking these questions:
What type of support is available for me and my team after onboarding is complete?
Does this product offer implementation consulting to help drive change and adoption, or are they simply providing training and documentation?
Are they willing to work with me and listen to my needs to continue to develop a better product?
What are the analytics and reporting capabilities?
The extent of analytics and reporting capabilities available to you within a PSA platform is critical to giving leaders the insights needed in order to confidently grow the business and team. Finding a PSA platform that allows you to leverage business intelligence, performance insights and forecasting can allow you to better predict resource needs, understand customer value and impact and make smarter financial decisions. Some questions you should be asking are:
Does the platform deliver the insights that are most important for professional service providers like me?
How are performance reports related to project accounting and utilization created and maintained?
How are forecasts generated for key KPI revenue, margin, capacity supply and demand?
What kind of data segmentation is available, i.e., account, team, vertical, etc.?
Selecting a PSA platform is a major decision, but it doesn’t have to be hard.
Taking the time to perform due diligence on the areas above will arm you with the questions and key considerations to bring to internal stakeholders as well as sales and support teams, which can all give you the data and confidence needed to invest in the right tool to help your business grow.
Interested in hearing more about what Parallax can do for your digital services company?
Customer lifetime value (CLV) is a popular metric used at SaaS and product companies, but we don’t see it measured as frequently at professional service organizations. We’re big proponents of using CLV as a digital agency KPI as it helps leaders make proactive strategic decisions that support digital services growth and increase the average CLV.
This article discusses the importance of utilizing customer lifetime value (CLV) to improve business operations and performance. It covers how to calculate customer lifetime value before providing four questions that can help digital service companies use CLV to better understand their business and inform strategic decisions.
The key takeaways from this article are:
Customer lifetime value (CLV) is a critical metric that can help digital service companies improve business operations and performance.
To measure CLV, it is important to use a formula that accounts for costs so that profit is calculated and not just revenue.
By bucketing customers and identifying patterns, digital service companies can target prospects and buyer personas similar to their most profitable customers.
Understanding which types of projects are most profitable can help digital service companies improve CLV across accounts by upselling their most profitable projects to customers that haven’t bought them but could benefit from them.
Charting customer lifetime value over time can help digital service companies pinpoint when margin typically starts to decline and take action to prevent it.
Customer lifetime value (CLV) calculates the total profit margin you can expect to earn from a customer throughout their entire lifecycle with your business.
Each company’s average CLV will vary based on average customer lifespan, the services they offer, and how well they retain and upsell existing clients. But there are several ways every digital services company can use CLV to improve business operations and performance.
How to Calculate Customer Lifetime Value
Google “how to calculate CLV,” and you’ll find numerous formulas. One simple way to calculate customer lifetime value is using this formula:
CLV = Average Revenue Per Customer (Annual) × Average Customer Lifespan x Gross Profit Margin
To get even more precise, your business can account for a variety of other factors that impact your CLV, including how likely each customer is to expand their engagement with you. First Page SEO shares a few factors to consider adding to your CLV calculation, including:
Likelihood (and value) of service expansion
Likelihood of new customer referral
Likelihood of reference or case study
Regardless of which formula you use to calculate CLV, it is critical to use one that accounts for costs, so you calculate profit and not just revenue.
Accounting for costs is important because different factors (e.g., the combination of resources you assign to a project) can affect project costs and how profitable a project is. The accounts and projects that generate the most revenue are not always the most profitable.
In a similar vein, profitability alone doesn’t identify your best customers. Some highly profitable customers could actually be your worst customers if they’re toxic or misaligned with the agency’s vision or culture. Profitability isn’t the only data point to identify your best customers, but it is an important one.
Utilizing Customer Lifetime Value at Your Digital Services Company
We want to help you use CLV to better understand your digital agency. Here are four questions customer lifetime value can help you answer to uncover important agency insights that inform your strategic decisions.
1. What types of customers are most profitable?
Not all customers are equal, so not all customers will have the same CLV. Go beyond simply calculating an average customer lifetime value across your portfolio by calculating CLV for each customer. Then, bucket customers into groups based on account similarities (e.g., company size, industry, the job title of executive sponsor) to get an average.
Calculating the average CLV of each customer type can help you identify patterns in your most profitable customers. For example, “our CLV is highest when an IT director at a consumer technology company with 500-1,000 employees hires us to solve a technology challenge.”
These patterns can help you tailor your sales and marketing efforts to target prospects and buyer personas similar to your most profitable customers.
To bucket customers and identify patterns, you need visibility into up-to-date CRM data. If you’ve developed sales operations best practices that keep data fresh, you can cross-check customers against things like the source of lead, company size, decision-maker, NPS score, primary business challenge, and more. You can get as granular or high-level as your business needs.
Reminder: The customers that bring in the most revenue are not always your most profitable customers. High-revenue customers could also have the highest costs that eat into your profitability. Or, depending on where the customer is in their lifecycle, their profit margin could be on the decline. These are all insights that CLV can help you uncover.
Parallax Insights | Account Dashboard Highlight
2. What types of projects are most profitable?
Uncovering patterns between your customers with the highest CLV is the first step to identifying your “best” customers. The next is to dig a little deeper to understand how various projects affect customer lifetime value.
If you have a different CLV between two similar customers, explore why that could be. Factors that could affect this include:
Project type: What kind of service are you providing and which is most profitable? For example, is it a wedge offering, mobile app development, user experience design, or paid media campaign?
Pricing structure: Are you charging based on the project, a retainer, or time and materials? Which seems to be most profitable for your agency?
Team makeup: Do you have your best (and most expensive) talent assigned to certain projects but have more junior employees managing others? How is resource allocation affecting profitability?
Digging into the data can help you determine what drives profitability within projects. It can also help you spot which projects are growing and becoming more valuable to customers (or declining and becoming less valuable).
Use this information to improve CLV across accounts by upselling your most profitable projects to customers that haven’t bought them but could benefit from them.
3. When does profit margin typically start to decline?
Chart customer lifetime value over time to pinpoint when margin typically starts to decline. If your average customer lifespan is three years, but margin starts to fall at two years, you can brainstorm ways to improve profitability at this stage.
This may be the right time in the lifecycle to introduce your customers to higher-value services, like the ones you identified as your most profitable projects. You might also realize you have a gap in your service offerings and need to invest in innovation to develop offerings that support customer needs for longer.
4. Which customers can we leverage for innovation?
Utilizing customer lifetime value also helps you pinpoint which accounts have profit wiggle room to test innovative ideas. Let’s say you have a highly profitable customer that isn’t nearing the point in its lifecycle when profitability declines.
You can offer this customer a new service that may not be profitable (yet) but that your team thinks could be a service offering with a lot of growth potential in the future. This customer provides you with a cushioned testing ground to vet the idea and build processes and methods.
The profitability of this account gives you the flexibility to take innovative risks that provide important business insights.
This innovative work is what McKinsey’s 3 Horizons of Growth advocates for in Horizon 2. If you only focus on your most profitable work (Horizon 1), you don’t invest the time necessary into predicting what customers will want from you next.
Agencies risk all of their services becoming commoditized if they don’t consistently wear their “innovation hat.”
Get the Data You Need to Calculate CLV With Parallax
Utilizing customer lifetime value requires real-time access to the data that informs it. It should be easy for your team to quickly identify the revenue and profitability of each customer and the profitability of each service area.
These insights help you determine proactively if a customer or service is becoming more or less profitable, which supports proactive strategic action.
Parallax provides consistent, reliable, and real-time data governance from sales to delivery and beyond so you can easily calculate CLV. Our forecasts give you a view into the future to predict where things are headed with customers, so you can make data-informed adjustments—before it’s too late.
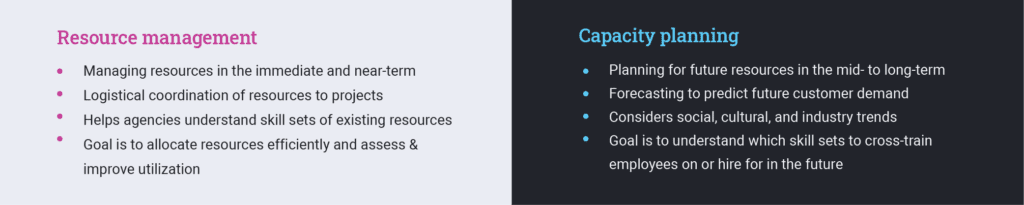
Resource management and capacity planning are indeed two different things. However, digital agencies must consider both as part of the same process to understand customer demand and effectively solve capacity challenges.
This guide will discuss the differences between resource management vs capacity planning and why your agency must use both.
Digital agencies spend a lot of time on the day-to-day management of resources. Resource management is the coordination of resources—the efficient assignment of the right people to projects. It helps agencies understand their current employees’ skill sets and what services they can deliver today.
The goal of resource management is often to maintain high utilization across all skill sets and roles. When agencies see a dip in utilization, their immediate response may be to push employees to find a way to bill more.
Many agencies also rely on resource management to tell them when it’s time to hire. They use the information to determine which roles they need to hire for or whether they need to outsource work to freelancers, contractors, or other agencies.
What is capacity planning?
Too often, agencies make hiring decisions without considering trends in customer demand. They’re managing their resources focused mostly on the here and now, but failing to forecast future demand in the long term.
Capacity planning helps agencies understand what their customers want now and predicts what they will want in the future. Knowing this can be the difference between investing in resources that support the agency’s future—or investing in ones whose skill sets you’ll have little need for down the road.
Resource management vs capacity planning: The key difference
By understanding what resource management and capacity planning are, the key difference between the two becomes apparent. While resource management focuses on assigning the right talent to keep projects moving forward in the “now,” capacity planning focuses on forecasting future needs.
It’s critical agencies know the difference between resource management and capacity planning and adopt behaviors that enable them to do both well. That way, they have the information needed to hire the right people and train for the right skill sets.
Using resource management and capacity planning to predict demand
Most agencies treat resource management and capacity planning as an either/or equation. However, agencies will quickly find themselves in deep water if resource management and capacity planning activities aren’t informing each other.
Agencies must address them as complementary parts of the same process. For example, to properly manage resources and hire for the right skill sets, you must also capacity plan. Capacity planning helps agencies read the tea leaves earlier by planning for future wants, needs, and social, cultural, and industry trends.
As a result, you can predict how customer demand is changing, understand how your services have changed over time, and assess the future of your services based on industry direction and demand.
How agencies lose when they don’t predict demand
Let’s consider a hypothetical scenario at an agency that spent so much time focused on resource management that they forgot to consider what was happening with customer demand (i.e., they weren’t capacity planning).
Warning: This situation might not feel all that hypothetical. It’s happened to us in our previous lives as agency leaders, and we know it happens at other agencies.
A mid-sized digital agency had a talented Flash developer on staff. He was a significant asset to the company, not just because he was highly skilled, but also because he represented the agency culture well.
Other employees admired him and he kept getting raises. As he made more money, the demand for Flash plateaued. But the agency wasn’t really paying attention; this employee had become such an essential part of the company culture. No one questioned his role or position in the agency.
Unfortunately, over time, he became too expensive. The agency couldn’t sell Flash development like it once could. The industry had moved on—front end development moved to HTML5 and Javascript. Unfortunately, the employee hadn’t learned those programming languages because the agency hadn’t invested in his training.
The business couldn’t justify what it was paying him and it was going to be too expensive to cross-train him. They lost a super valuable resource because no one took the time to understand how customer demands and industry trends would affect the agency’s resources, specifically this employee’s role. The agency failed to anticipate shifts in demand and value—and lost out big.
The benefits of predicting customer demand
Capacity planning helps you identify which of your team’s skill sets are becoming less relevant and profitable, so you know when to invest in professional development and training. Investing in the right employees at the right time ensures your people work toward a skill set that’s more valuable for the business’s future.
This not only keeps your employees engaged because they feel supported, but it enables you to invest in the right place to support future business growth. You’ll feel better about an employee having a lower billable capacity as they’re training when you know they’re working toward something that will support the business’s future.
1. You sustain the business
Just like with Flash, eventually, certain types of work become commodities. This changes the value and the demand for work, and agencies have to be ready to innovate and adjust so they don’t become irrelevant.
Capacity planning helps you sustain your business by considering the capacity you have available from individual skill sets on your team and how that stacks up to customer demand. It enables you to translate customer demand to your ability to deliver on it.
You get a clearer understanding of your capacity to take on new types of work (the stuff that supports innovation) and the capacity you have to keep doing your bread and butter work (the stuff that’s profitable today).
2. You invest energy and resources in the right places
Capacity planning helps you identify which of your team’s skill sets are becoming less relevant and profitable, so you know when to invest in professional development and training. Investing in the right employees at the right time ensures your people work toward a skill set that’s more valuable for the business’s future.
This not only keeps your employees engaged because they feel supported, but it enables you to invest in the right place to support future business growth. You’ll feel better about an employee having a lower billable capacity as they’re training when you know they’re working toward something that will support the business’s future.
3. You retain your best people
Investing in the right people at the right time based on what capacity planning tells you also helps you retain your best people. Keep your key employees in the loop about how demand is changing in the organization, so they can see where they’re most valuable to the business today—and where they will be in the future.
Better understand demand with Parallax
Parallax can help your business understand capacity beyond total hours and headcount of your resources. Our product’s capacity planning tool gives you a clearer picture of customer demand, so you can make strategic investments today to keep your business competitive and relevant tomorrow. Sign-up for a free demo today!
Digital services companies set themselves apart from each other with the caliber of their craft, method, and people. But when it comes to running the business and managing operations, we’re all more alike than different.
This should be good news because you don’t have to spend creative energy reinventing the wheel for resource planning, forecasting, or reporting. You can spend more time doing what you’re good at — your craft!
It also means there are benchmarks you can reference to see just how well you’re performing compared to other service companies. But calculating business performance metrics can be complicated and often takes a comfortable seat on the back burner because other priorities seem more pressing.
Luckily, we offer a simple Industry Benchmark Calculator to help you quickly visualize your performance and compare it to agency benchmarks.
This article will provide guidance on how to use the Industry Benchmark Calculator, a tool designed to help digital services companies evaluate their operational performance and compare it to industry benchmarks.
By following the outlined steps, you can quickly visualize performance and identify areas for improvement.
Key Takeaways:
Tracking, calculating, and benchmarking performance is crucial for driving growth and overcoming operational challenges.
The Industry Benchmark Calculator requires users to input operational, sales, and revenue data, as well as utilization and revenue capacity information.
The calculator helps users identify key performance metrics such as sales bookings, planned backlog, write-offs, billable utilization, and employee revenue.
Comparing your results to industry benchmarks can reveal areas where your business can improve to stay competitive.
Implementing best practices and investing in tools like Parallax can help businesses grow and operate more efficiently.
Put simply, industry benchmarks are the metrics digital services companies use to measure their performance when compared to other companies in their industry. These benchmarks help you determine the overall health of your business and areas where you must improve.
Why Tracking, Calculating & Benchmarking Performance Is Critical
At Parallax, we believe services organizations like agencies and software development studios must prioritize gaining visibility into key organizational metrics. In fact, we think understanding operational performance and having an action plan for how to improve it is key to driving growth.
It’s what helps a business overcome the growth stuck point — allowing them to scale from heroic efforts and gut instincts to smooth and strategic operations.
To make it easier for you to track and calculate your business performance — and compare yourself against benchmarks — we created the Industry Benchmark Calculator.
Simply enter operational inputs, sales and revenue targets, utilization data, and revenue capacity data, and you’ll see how your performance compares to the following benchmarks:
% of gross revenue targets in the sales bookings
% of gross revenue targets Planned in the backlog
Write-offs
Billable utilization
Employee revenue
Revenue per billable employee
Revenue per employee
How to Calculate Benchmarks Using the Industry Benchmark Calculator
Ready to get started? Access the industry benchmark calculator, create your own copy of it, and then follow our instructions below to calculate your performance. The outputs you get from the calculator are meant to be directionally correct, giving you a sense of how you stack up to benchmarks and where it’s best to focus your energy.
If you need help filling out the calculator or want to talk through how to dial in some of these numbers, shoot us a note at hello@getparallax.com — we’d love to help!
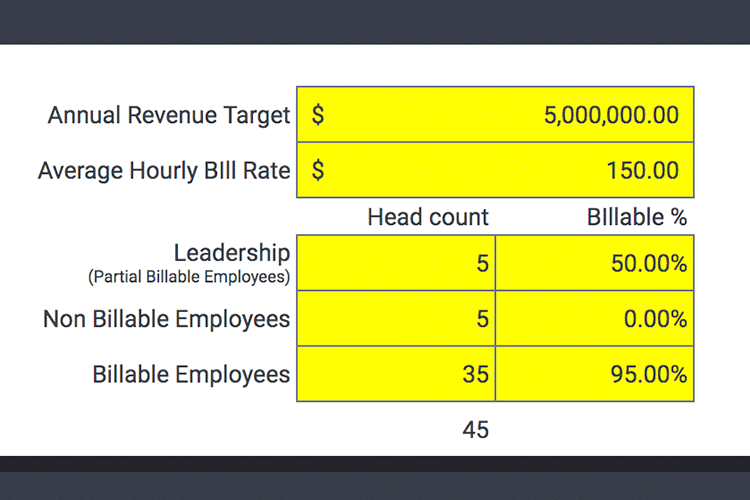
Step 1: Business Inputs
The purpose of this first step is to understand where your organization stands today with its annual revenue target and team makeup. These inputs impact the rest of the calculator, so it’s important to enter them as accurately as possible.
Fill in your Annual Revenue Target and your Average Hourly Bill Rate. If you use a blended rate or average rate by role, you’ll need to do a little math to find your average rate.
Enter how many of your employees are billable, partially billable (e.g., leadership), and non-billable.
Next to each employee group’s headcount, enter the average percentage of time you expect each group to bill.
Step 2: Sales and Revenue Targets
This section helps you map your revenue targets by quarter to account for natural seasonal dips or upticks across the calendar year.
The calculator will estimate how much revenue should be identified in the sales pipeline, in sales bookings, and in the planned backlog to hit your revenue targets each quarter.
Proactively understanding these numbers will help you spot dips in the sales pipeline you may need to fill by stepping up your business development efforts or by investing more in marketing.
Gross Revenue Targets
Enter your revenue distribution by quarter, accounting for expected seasonal dips or upticks. The total should equal 100%.
The output — Quarterly Gross Revenue Targets (C21) — tells you how much revenue you need to earn each quarter to hit your Annual Revenue Target (G8).
Sales Pipeline Targets
The Sales Booking Target (C25) tells you how much you need to sell to hit your Quarterly Gross Revenue Targets (C21). You should aim for 110% of your Quarterly Gross Revenue Targets in sales bookings because, if you’re like most services companies, you’re likely to lose some of the booked revenue along the way.
Deal Pipeline Relative to Bookings Target (C27) is the first benchmark on the calculator. Benchmarks suggest that the sales pipeline should have 125 – 275% of what the Sales Booking Target (C25) is in qualified opportunities.
The calculator defaults to the benchmark midpoint of 182%, but you can use the dropdown to adjust this to the low (125%) or high (275%) benchmark to see how it impacts your pipeline targets.
Based on the Deal Pipeline Relative to Bookings Target benchmark (C27) you choose for each quarter, you get a Pipeline Value Target (C29). This number tells you how much revenue you should have in your sales pipeline each quarter to meet your Sales Bookings Targets (C25).
Finally, head to your CRM and see how much projected revenue your pipeline currently has for each quarter. Enter this into the calculator by quarter.
Based on what you enter for Actual Revenue Per Quarter in the Sales Pipeline (C31), the calculator will tell you how you’re performing against that benchmark (C32).
You should have at least 125% of your Sales Booking Target (C25) in your sales pipeline on the low end. A high-performing company should have 275% of its Sales Booking Target (C25) accounted for in its sales pipeline.
Planned Backlog Targets
Benchmarks suggest that you should have 23 – 61% of your Quarterly Gross Revenue Target (C21) in your planned backlog.
The calculator defaults to the benchmark midpoint of 50%, but you can use the dropdown to adjust this to the low (23%) or high (61%) benchmark to see how it impacts the amount of revenue you need in your planned backlog each quarter (C36).
Your Planned Backlog Revenue Target (C35) is how much revenue you have accounted for in the work you’ve already planned or started working on (i.e., your planned backlog).
Next, estimate how much planned revenue you currently have in your planned backlog. (If you’re a Parallax customer, you can access this directly from your dashboard). Enter this into the calculator by quarter.
Based on what you enter for Actual Planned Revenue in Backlog (C38), the calculator will tell you how you’re performing against that benchmark (C39). You should have at least 23% of your Quarterly Gross Revenue Target (C21) in your planned backlog on the low end.
A high-performing company would have 61% of its Quarterly Gross Revenue Target (C21) accounted for in its planned backlog.
Finally, choose your Average Write-Off Percentage (C41) from the dropdown menu. A write-off is the percentage of revenue that you lose in an average period.
Benchmarks suggest that agencies should write off no more than 4% at a low level, while high-performing companies should only write off 1%.
Once you select your Average Write-Off, it will calculate how much of your Gross Revenue Target (C21) you’re projected to lose each quarter.
Once you complete all of the inputs for this section, the calculator will give you your Net Revenue Target. This is how much you’re projected to net in revenue after write-offs.
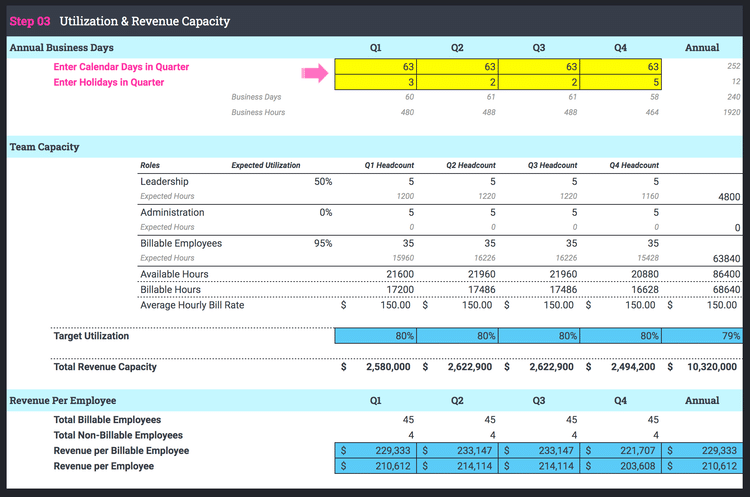
Step 3: Utilization & Revenue Capacity
This section helps you evaluate whether you can actually earn the revenue you’re targeting based on your employee headcount, utilization, and revenue capacity.
If your Total Revenue Capacity is lower than your Annual Revenue Target, it’s a sign you may need to hire more people or implement strategies to increase utilization.
Annual Business Days
The first step to thinking about revenue capacity is knowing how many hours there are available to complete billable work. Calculate this by entering the number of calendar days in each quarter and the number of holidays per quarter.
The calculator will then tell you how many business days (E52) and business hours (E53) you have to work with each quarter and annually.
Team Capacity
The Team Capacity section is completed for you using the inputs you added in Step 1. Based on what you entered for each employee group’s expected utilization, headcount, and average bill rate, the calculator will tell you your Target Utilization (C67) and Total Revenue Capacity (C69).
Compare your Target Utilization (C67) to the Billable Utilization Benchmark in the sidebar to see how you’re performing. Benchmarks suggest that agencies should have at least a 60% utilization rate at a low point, and high-performing agencies should strive for an 85% utilization rate.
Compare your Total Revenue Capacity (C69) to your Annual Revenue Target (G8) and Quarterly Gross Revenue Targets (C21) to see if you have the people and utilization level necessary to hit your targets.
Revenue Per Employee
The Revenue Per Employee section is also completed for you using the inputs you added in Step 1 and your calculated Total Revenue Capacity (C69).
Compare your Revenue per Billable Employee and Revenue per Employee to the benchmarks in the sidebar. The difference between these two numbers is that Revenue per Employee accounts for all employees, including those who don’t bill to clients (e.g., admins and finance).
Revenue per Billable Employee only accounts for employees that bill clients for their time. Benchmarks suggest that at a low level, agencies should bill at least $104,000 per Billable Employee. High-performing agencies should bill $291,000 per Billable Employee.
The benchmark for Revenue per Employee ranges from $77,000 at a low point to $253,000 at a high end.
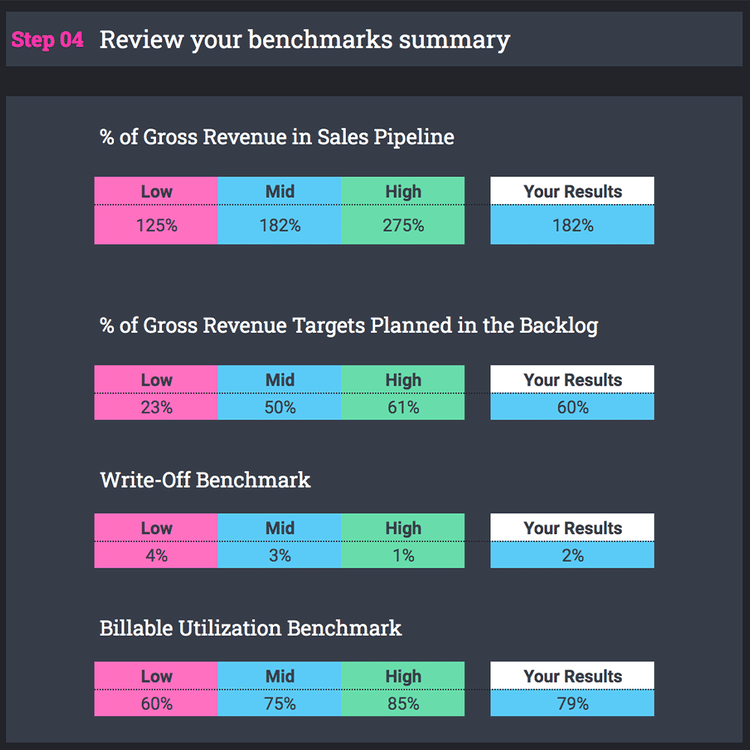
Understanding the Industry Benchmark Calculator Results
The final step of the benchmark calculator summarizes your operational performance results compared to the agency benchmarks. This helps paint a clearer picture of where your agency needs to improve its performance.
For example, you’ll see a clearer picture of your revenue per employee benchmark, billable utilization benchmark, and other key metrics. Let’s discuss the results you may receive and how to improve.
Percent of Gross Revenue Targets in the Sales Booking Benchmark
What it means: How much in sales bookings you need compared to your gross revenue targets.
How to improve: If you have too little in sales bookings, it’s a sign that you need to improve your business development efforts. Ask yourself:
Does my sales team have the resources it needs to be successful?
How effectively does my sales team communicate with my delivery team?
Does sales understand the unique value we provide, and can it communicate it well?
Percent of Gross Revenue Targets Planned in the Backlog Benchmark
What it means: How much in planned work (already sold and accounted for in revenue) you need compared to your gross revenue targets.
How to improve: If you have too little in your planned backlog, it’s a sign you need to improve how efficiently and effectively you close deals. Ideally, you would be able to schedule projects further out in the year as well. However, it’s pretty common for services companies not to have a ton of work in their planned backlog.
Write-off Benchmark
What it means: How much revenue you lose in an average period due to fixing mistakes, offering something to a client at no or low cost, or incorrectly estimating the amount of time necessary to complete something.
How to improve: Write-offs will happen; it’s a normal part of business. However, standardizing your services can help reduce write-offs because they allow you to better understand and plan work.
They’re projects you’ve done many times before, so you know what to expect, and you’re less frequently caught off guard.
Billable Utilization Benchmark
What it means: How much of your employees’ time, on average, is applied to billable work.
How to improve: Utilization is a lagging indicator, so by the time most agencies realize they’re falling short on it, it’s too late to improve it. When the team leads ask employees to focus on hitting billable hours over anything else, it can cause employees to become disengaged, dissatisfied, and resentful.
A better approach to improving utilization is to encourage and empower employees to focus on how best to deliver value.
It’s equally (if not more important) for leaders to ensure their teams have enough work opportunities to keep them busy so that they can deliver that value.
To track and measure utilization more proactively, implement the following utilization best practices:
Update and review project-level resource plans each week.
Better communicate the value of timesheets and adopt a weekly process that verifies all timesheets are complete.
Regularly review planned utilization against utilization targets to identify dips in the sales pipeline that the agency needs to fill.
Employee Revenue Benchmark
What it means: How much revenue you make per employee (including per billable employee and per employee on average).
How to improve: Increasing the amount of revenue earned per employee often comes down to improving the efficiency of your employees’ work. One of the best ways to do this is to standardize 60-80% of your service offerings.
Put resources against your sales pipeline opportunities so you proactively know if you have too few or too many staffed resources to deliver your projects.
Improve the consistency of project pricing by encouraging collaboration between sales and delivery.
Raise your rates. It’s easier to raise rates when you understand the value of your time, which you can calculate better using things like supply and demand forecasting.
Next Steps: Invest in Success With Parallax
If you completed the agency benchmark calculator, it’s a sign you’re ready to invest in your business’s growth and success. We built Parallax to help teams like yours scale the magic that makes them great.
We’re passionate about empowering services companies with information and creating a shared perspective across teams. With Parallax, you can focus more on what you’re great at and less on recreating new ways to run your business.
If you’d like to see how Parallax improves visibility into key organizational metrics and enables you to act more proactively and strategically, schedule a demo. We’ll walk you through how our product can give your team the information it needs to grow to its next level of greatness.